Customer Logins
Obtain the data you need to make the most informed decisions by accessing our extensive portfolio of information, analytics, and expertise. Sign in to the product or service center of your choice.
Customer Logins
BLOG
Aug 08, 2023
Canadian oil sands continue their trend of GHG intensity reductions in 2022 — Down 23% since 2009
A more modest rate of production growth and ongoing intensity reductions allowed the oil sands to hold the line on absolute emission in 2022
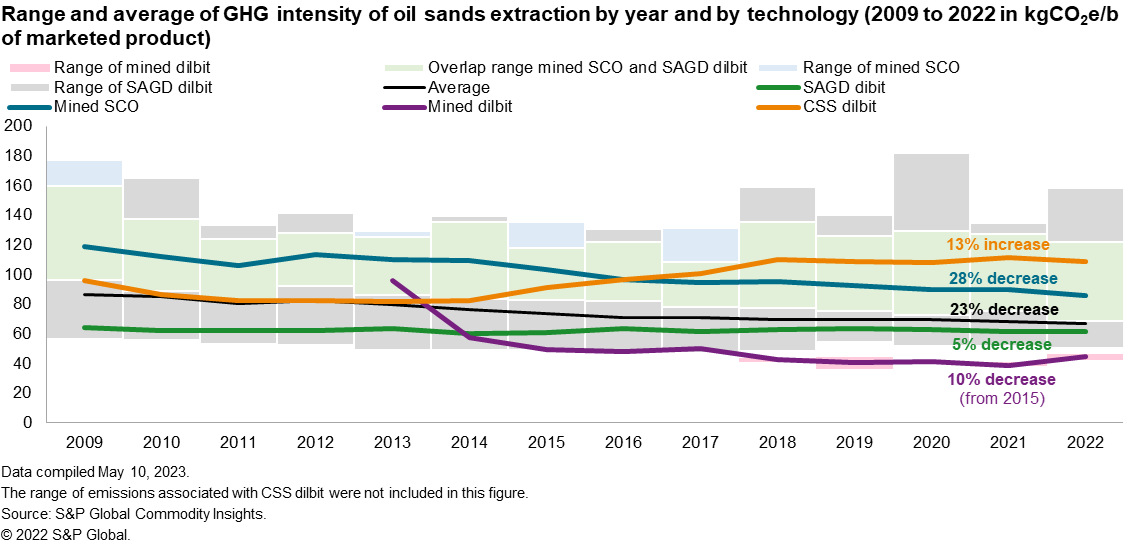
The greenhouse gas (GHG) intensity of the Canadian oil sands continued their decade-long decline in 2022. Since 2009, S&P Global Commodity Insights estimates that the annual average GHG intensity of the Canadian oil sands has fallen 23% or nearly 20 kilograms of carbon dioxide equivalent per barrel (kgCO2e/b) of marketable product (synthetic crude oil [SCO] or diluted bitumen [dilbit]).[1] The cumulative reductions in GHG intensity over the past two years were among the highest over the past half decade — exceeding prior expectations.[2]
Over the past 13 years, integrated mining operations that market SCO (referred to as "mined SCO" hereafter) experienced the greatest reduction. As seen in Figure 1, from 2009 to 2022 the GHG intensity of mined SCO fell 28% or 33 kgCO2e/b to average 86 kgCO2e/b in 2022. At the same time, the growth of the relatively less GHG-intensive production from steam-assisted gravity drainage (SAGD) projects that market dilbit and newer unintegrated mines that market dilbit (mined dilbit) also contributed to pulling the overall oil sands average down.

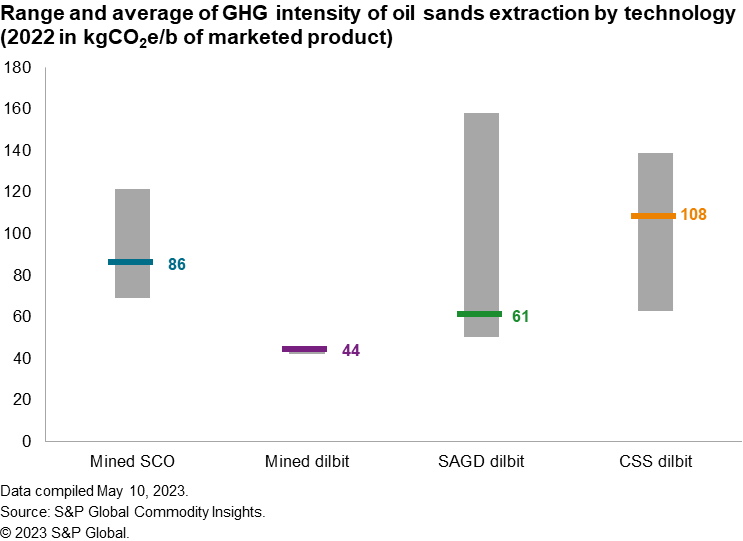
Compared with 2021, the overall GHG intensity of the Canadian oil sands was 2% lower or about 1.5 kgCO2e/b in 2022. Consistent with longer-term trends, the largest year-on-year reduction came from mined SCO, which fell 4% or nearly 4 kgCO2e/b. This was followed by very modest reduction in SAGD dilbit and a 2% reduction from cyclic steam stimulation (CSS) that also markets dilbit (CSS dilbit) to average 61 kgCO2e/b and 108 kgCO2e/b in 2022, respectively. Newer unintegrated mines — mined dilbit — experienced a 15% rise in GHG intensity to 44 kgCO2e/b in 2022 but remained the least GHG-intensive form of oil sands production. The challenges experienced by unintegrated mines appears linked to mine pit issues at the Fort Hills facility. As these issues are resolved the GHG intensity of mined dilbit should fall back in line with historical trends.

A point of caution is that we continue to find wide variations in oil sands emissions and the averages presented may not accurately represent any one operation. We estimate that in 2022 the GHG intensity of Canadian oil sands marketable product had a range of 116 kgCO2e/b. The lower end was set by the mined dilbit operations, and the upper bound was the result of a thermal operation that appeared to have some operational challenges. This variation can be seen in Figure 1, and Figure 2 presents the detail of each oil sands extractive segment average intensity and range in 2022.
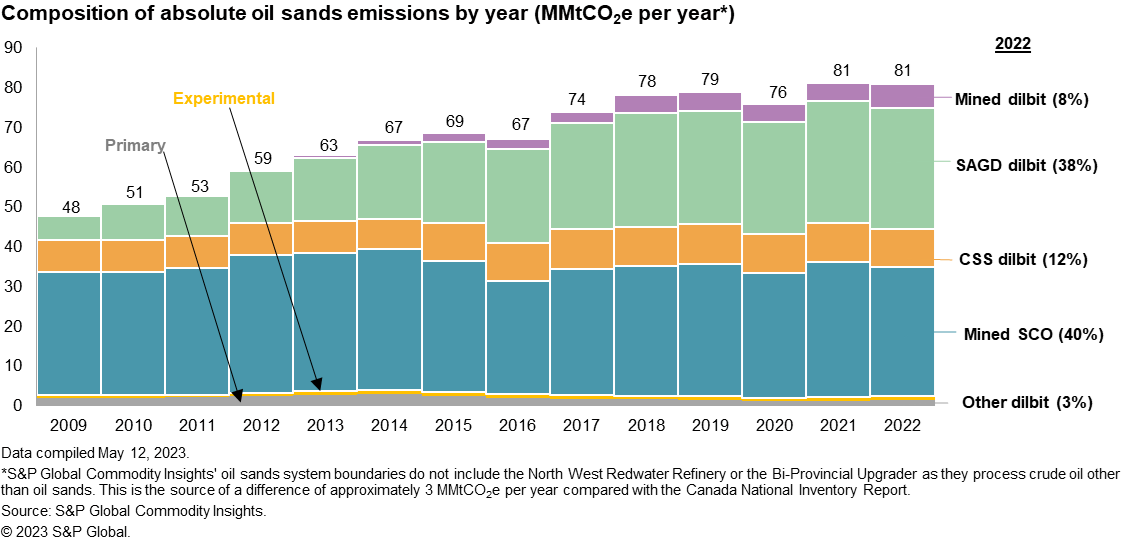
Absolute GHG emissions in the Canadian oil sands did not rise in 2022, remaining at 81 million metric tons of carbon dioxide equivalent (MMtCO2e). This is notable as this occurred despite a modest rise in production (over 50,000 b/d). This may mark the first time since 2009 (which is as far back as S&P Global Commodity Insights tracks oil sands emissions) that emissions did not rise in the absence of a major market disruption and production reduction.[1] As can be seen in Figure 3, absolute emissions experienced year-on-year reductions in both 2016 and 2020. However, these occurrences were the result of large-scale supply disruptions associated with Fort McMurray wildfires in 2016 and the COVID-19-driven demand shock (and production shut-ins) in 2020.

Absolute oil sands emissions growth was kept at bay in 2022, not only because of ongoing intensity improvements, but also as the rise in production was not ubiquitous across oil sands operations. Production from some less GHG-intensive segments grew at a rate that more than offset modest production declines from some of the more GHG-intensive forms of production.
S&P Global Commodity Insights expects GHG intensity reductions to continue and even accelerate. However, with more pronounced production additions expected over the next few years, absolute emissions are still expected to continue to build until the middle of this decade before beginning to decline as GHG intensity improvements are anticipated to overtake a slowing growth profile. Nevertheless, the fact that absolute emissions appear to have stalled temporarily in 2022 may indicate the potential for absolute emissions to peak sooner and at a lower level than previously estimated.
[1] S&P Global Commodity Insights has published annual oil sands intensity updates for the past few years. Our system boundary of oil sands GHG intensity includes the emissions associated with not only combustion of fuels used on site, but also the production of those fuels, as well as any electrical imports or exports. The production of these fuels is an area of continuing research and may be subject to change. Our approach focuses on the GHG intensity of marketed product. All oil sands facilities separate bitumen from the oil sands ore. Some, however, subsequently process the recovered bitumen to market a synthetic crude oil, while others have opted to blend the extra-heavy bitumen with lighter hydrocarbons and market diluted bitumen blends or dilbit. Our estimates of absolute oil sands emissions, however, are focused on scope 1 emissions consistent with Canada's National Inventory reporting.
[2] For more information on prior expectations, see the S&P Global Commodity Insight The trajectory of oil sands GHG emissions: 2009-35, www.ihsmarkit.com/oilsandsdialogue, April 2022.
[3] S&P Global Commodity Insights has developed its own independent model and estimate of Canadian oil sands GHG emissions. S&P Global Commodity Insights' estimate does not include emissions from the Sturgeon Refinery (also often referred to as the North West Redwater refinery) or the Bi-Provincial Upgrader. We believe this is why our estimates for absolute oil sands emissions are approximately 3 MMtCO2e per year lower compared with the Canada National Inventory Report. See "Canada's official greenhouse gas inventory," www.canada.ca/en/environment-climate-change/services/climate-change/greenhouse-gas-emissions/inventory.html.
This article was published by S&P Global Commodity Insights and not by S&P Global Ratings, which is a separately managed division of S&P Global.
{"items" : [
{"name":"share","enabled":true,"desc":"<strong>Share</strong>","mobdesc":"Share","options":[ {"name":"facebook","url":"https://www.facebook.com/sharer.php?u=http%3a%2f%2fqa.www.spglobal.com%2fcommodityinsights%2fen%2fci%2fresearch-analysis%2fcanadian-oil-sands-continue-their-trend-of-ghg-intensity.html","enabled":true},{"name":"twitter","url":"https://twitter.com/intent/tweet?url=http%3a%2f%2fqa.www.spglobal.com%2fcommodityinsights%2fen%2fci%2fresearch-analysis%2fcanadian-oil-sands-continue-their-trend-of-ghg-intensity.html&text=Canadian+oil+sands+continue+their+trend+of+GHG+intensity+reductions+in+2022+%e2%80%94+Down+23%25+since+2009+%7c+S%26P+Global+","enabled":true},{"name":"linkedin","url":"https://www.linkedin.com/sharing/share-offsite/?url=http%3a%2f%2fqa.www.spglobal.com%2fcommodityinsights%2fen%2fci%2fresearch-analysis%2fcanadian-oil-sands-continue-their-trend-of-ghg-intensity.html","enabled":true},{"name":"email","url":"?subject=Canadian oil sands continue their trend of GHG intensity reductions in 2022 — Down 23% since 2009 | S&P Global &body=http%3a%2f%2fqa.www.spglobal.com%2fcommodityinsights%2fen%2fci%2fresearch-analysis%2fcanadian-oil-sands-continue-their-trend-of-ghg-intensity.html","enabled":true},{"name":"whatsapp","url":"https://api.whatsapp.com/send?text=Canadian+oil+sands+continue+their+trend+of+GHG+intensity+reductions+in+2022+%e2%80%94+Down+23%25+since+2009+%7c+S%26P+Global+ http%3a%2f%2fqa.www.spglobal.com%2fcommodityinsights%2fen%2fci%2fresearch-analysis%2fcanadian-oil-sands-continue-their-trend-of-ghg-intensity.html","enabled":true}]}, {"name":"rtt","enabled":true,"mobdesc":"Top"}
]}


