High short interest US equities generate alpha amid sell-off
- Most shorted US stocks underperform by 67bps YTD
- Strongest relative underperformance in semiconductor stocks
- Lessons from 2016 loom large
With the sell-off pushing US equity returns into negative territory for 2018, highly shorted stocks have delivered alpha for investors. The average US equity has returned -5.6% YTD, while stocks with at least 5% of shares short have returned -6.3%. Short sellers have not meaningfully changed positioning and have allowed short balances to decline with share prices thus far.
Stocks in the semiconductor industry have seen the greatest differentiation between average returns and those of the most shorted stocks. The most shorted stocks have averaged a -16% return YTD versus an average return of -11% for the group. The worst performing stocks in the group – Impinj Inc and Macom Technology Solutions Holdings Inc. – both had short interest above 15%.
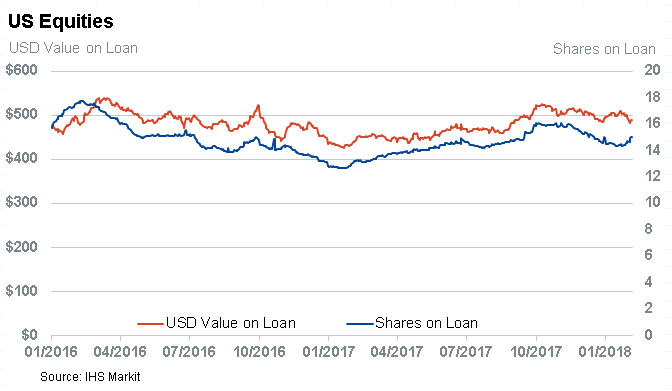
For short sellers, Q1 2016 stands as a stark reminder that increasing positions during a correction can have a disastrous impact on performance. During the first five weeks of 2016, short sellers of US equities increased short balances by $6.5B, while the average share price declined in value by 11%.
The $6.5B increase in balances represented a 1.3% increase, meaning short sellers were rapidly increasing short positions to maintain a relatively constant short exposure in dollar terms while share prices fell. Stocks with over 5% of outstanding shares short declined in value by 16.6% on average through February 7th 2016 – encouraging short sellers to press popular shorts.
The sell-off ended on February 8th and US equities resumed their levitation to the detriment of short sellers. While the most shorted stocks delivered 4.7% alpha during the first five weeks of the year, they promptly gave it all back during the next five weeks, outperforming the average equity return by 4.2%.
Although short balances continued to increase until March 31st, purely as the result of price changes, the total number of shares short peaked on Feb 12th. This was particularly painful given the increased positioning and kicked off a trend of short covering which extended through the rest of the year.
Short demand recovered in 2017, but remains below the level seen in Q1 2016. Short covering has been the trend since last fall, which is notable because October was a strong month for short alpha.
Holding off on pressing positions proved prescient with November and December both yielding negative factor returns according to Research Signals from IHS Markit. Since the end of January we’ve seen a marginal increase in demand, but nominal short balances are still below where they were at the start of the year.
One notable aspect of the start of 2016 was that highly shorted large cap stocks also meaningfully unperformed. Looking at US equities with at least $5bn in market cap at the start of 2018, the most shorted stocks have outperformed the average return by 180bps. This suggests while there have been pockets of panic selling, we’re not seeing the broad sell-off of risk assets that was seen at the start of 2016.
Or, depending who you ask, not yet.
For this analysis, only stocks with at least $250m in market cap and a price greater than $1 at the start of the respective years have been included. Except where referring to short interest factor, which ranks all stocks based on short interest, “most shorted” refers to stocks with at least 5% of market cap sold short.
S&P Global provides industry-leading data, software and technology platforms and managed services to tackle some of the most difficult challenges in financial markets. We help our customers better understand complicated markets, reduce risk, operate more efficiently and comply with financial regulation.
This article was published by S&P Global Market Intelligence and not by S&P Global Ratings, which is a separately managed division of S&P Global.


