Forecast dividend yield basket outperforms
Basket of US large caps selected using IHS Markit Dividend Forecasts data outperformed the US broad market from 2010 to date.
- Selecting stocks with high forecast dividend yields, using IHS Markit estimates, resulted in 20.9% outperformance compared to historical trailing yields.
- Back-testing results since 2010 indicate that the Dividend Forecast Yield basket (DFY Basket) rose 269.1% vs. 231.3% for the MSCI USA TR index.
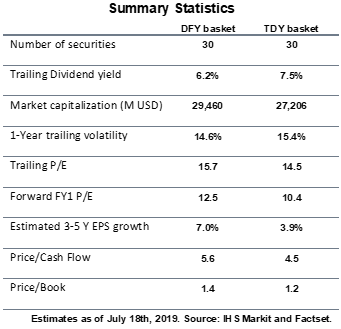
- The Dividend Forecast Yield Basket (DFY basket) was also less volatile at 14.6%, compared with 15.4% for the Trailing Dividends Yield Basket (TDY basket).
Source: IHS Markit and Factset.
Dividend stocks are an oft-cited investment strategy for enhancing total portfolio returns. They provide a steady income component and act as a safeguard, through lower volatility, during market downturns. Traditionally, dividend factor indices are calculated using trailing dividend yields, overlooking changing market conditions, revisions to dividend policies and company-specific turnarounds. However, selecting high forward yield stocks reflects the latest management decisions on shareholder remuneration and updated earnings estimates from analysts.
The Dividend Forecasting basket (DFY basket) displayed above was constructed selecting the 30 highest dividend yielding stocks from a broad universe of large cap US companies, with quarterly rebalances. We used IHS Markit's Dividend Forecasting historical forecast dataset, which contains estimates of individual distributions and their payment schedules since March 2010. From inception until July 2019, the basket would have increased 269.1% compared to 231.3% for the MSCI USA Total Return index. It also outperformed the 210.5% return reported by the S&P High Yield Dividend Aristocrats, one of the most tracked dividend factor indices in the US market.
The basket was constructed with an equal weighting methodology, providing exposure to typically high yielding sectors such as Financials and Industrial Services, which tend to have more attractive dividend policies compared to other sectors.
Source: IHS Markit and Factset.
To measure the added value of using dividend estimates to construct stock baskets, compared to historical payout data, we recreated the basket with trailing data using the same methodology for a like-for-like comparison. We created a Trailing Dividends Yield basket (TDY) that was built upon the top 30 high dividend yield stocks using the same universe of stocks but relying on the prior year's dividend as an input.
Source: IHS Markit and Factset.
Incorporating dividend estimates allows us to use more up-to-date picture of changes to payout policies, upcoming decisions pertaining shareholder remuneration and future earnings performance that otherwise would take longer to incorporate. Removing stocks that could potentially decrease dividends due to an anticipated deterioration in earnings or adding stocks which are likely to instigate dividend distributions is a superior approach that creates value in the long run.
The DFY basket has delivered an average dividend yield between 5-6% since inception whilst providing high-single-digit weighted average earnings growth at 7%, almost double the 3.9% earnings growth record of TDY. This demonstrates that stocks selected using forward looking estimates have better earnings momentum compared to those included based on historical data and not that they have high yields due to deteriorating share prices.

The results obtained from the back-testing point out that incorporating dividend estimates to build stocks baskets using dividend factors, would enable more up-to-date information of the upcoming capital allocations and a more accurate representation of earnings outlook. Therefore, it has been proved on the US market, starting from 2010 up until now, that using dividends estimates, built upon a fundamental analysis approach, would have yielded better risk-adjusted returns compared to historical dividend records.
S&P Global provides industry-leading data, software and technology platforms and managed services to tackle some of the most difficult challenges in financial markets. We help our customers better understand complicated markets, reduce risk, operate more efficiently and comply with financial regulation.
This article was published by S&P Global Market Intelligence and not by S&P Global Ratings, which is a separately managed division of S&P Global.
