Global PMI survey quality
- Survey incentives play a major role in why some surveys work better than others in tracking actual economic conditions
- By supplying valued reports as rewards for participation, and engaging with survey contributors, PMI surveys produce advance indicators of real-world economic trends, avoiding some of the problems with survey fatigue evident in official data
- Errors and volatility in official data have in the past sent misleading signals about the economy, and make it more challenging for survey data to prove their accuracy
In a world of survey fatigue, and suggestions that the quality of official economic data has deteriorated due to difficulties in encouraging companies to participate in surveys for the collection of data such as gross domestic product (GDP) and employment, we look at how survey incentives have played a major role in explaining why some surveys work better than others in tracking actual economic conditions.
Who responds to surveys, and why?
Do 'ordinary' people fill in questionnaires? Questions are sometimes raised as to the quality of survey respondents, as busy executives are perceived to have little time to accurately complete questionnaires. In the case of IHS Markit's PMI surveys we ensure that, from an economics perspective, completing the questionnaires is very rational behaviour. This consideration makes the PMI survey methodology different from official economic data surveys conducted by governments, in that participating in the PMI includes a strong value proposition, which we refer to as our 'give-get' model.
In practice, a survey works best if participants get something back that they value as a reward for the contribution they give, though it's important any reward does not bias their response. In the case of the PMI surveys, respondents are not paid for participating in the surveys - instead they are given access to the survey results for free. In fact, respondents don't just get their own industry report summary, but also reports on their customer and supplier markets, both from a geographical- and industry-specific basis.
We know from our research that executives value this information. The majority of survey participants use the PMI reports provided back to them in their own business decision making, whether it's for benchmarking sales performance relative to peers, forecasting revenues or negotiating with suppliers and customers. Here's an example from a UK-based manufacturer who participates in the PMI:
"The survey reports are useful to our business in a number of ways. Firstly, it reaffirms our own findings on how input prices on certain materials are being affected. This gives us some confidence that competitors are likely to feel the effects also and shows what factors are actually creating the increases.
"This then tells us how knowledgeable our agents and suppliers are, and whether they are supporting any negotiations on actual events rather than just seeing an opportunity to get more money for raw materials. It also gives me a bargaining tool when I can assess if impacts are long or short term.
"It is also useful to see the growth areas within world economies. Our sales force can target those areas to see if we can gain some of the wealth, or alternatively compare if our industry is growing in the same countries at similar rates. Whilst we do get informed on business developments and growth within our group, the information can sometimes have a positive slant more engineered by financial figures than economic activity. This obviously has a bearing on our own strategic thinking."
These days, PMI questionnaires can be completed very easily and quickly online, meaning just a few minutes' work are rewarded with valuable information that others have to pay for.
We now have over 28,000 companies participating in the monthly surveys, which enjoy a very low drop-out rate for contributors. Respondents include senior executives from a vast number of the world's leading companies, as well as many owners of small and medium-sized firms, ensuring accurate representation of actual business conditions
Participation rates have improved with the advent of email and internet-based data collection (and of course web-based distribution of survey rewards to panel members), and as the PMIs have become more global (meaning we can offer even greater incentives to contributors in terms of global economic reports and sector-specific analysis of markets).
Where questions need to be asked, however, is in relation to surveys such as the collection of GDP data by governments. Here, the value proposition for someone to complete an official survey accurately is low. The act of providing detailed (and accurate) numbers relating to turnover or employment and wages, for use in GDP and labour market statistics, brings no direct reward to the person filling in the government questionnaire.
Perhaps it's therefore not surprising that GDP and similar official data may have issues with data quality, and the contrast highlights how the "give-get model" of rewarding PMI survey contributors is a much-overlooked factor behind the survey's accuracy.
Survey reliability
At the outset, it's important to consider how to measure survey accuracy. This is not as straightforward as you might at first expect. For many surveys such as the PMI, the perceived aim is to accurately anticipate changes in official data such as GDP and manufacturing output. The key problem here is alluded to above: how confident are we that the official data are correct? The answer here is of course, not very. In fact, a motivation behind commencing the PMI business back in the 1990s was a dissatisfaction with the quality of official data, and notably GDP, which was prone to revision and was notorious for sending misleading signals on the health of the economy in many countries.
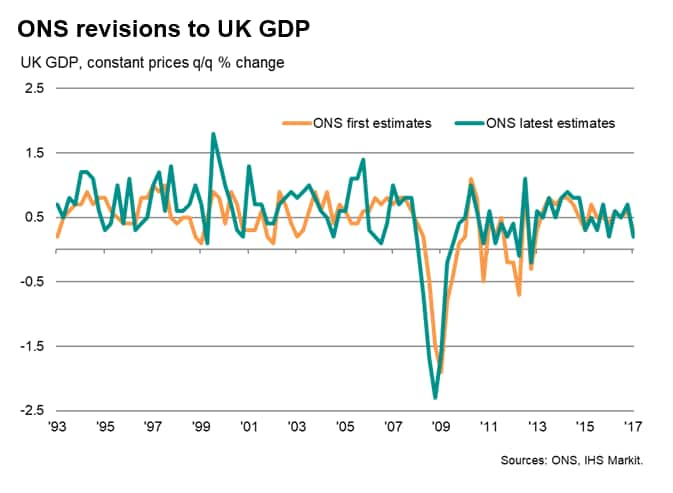
An example of the extent to which GDP data are revised is shown in our chart below, which plots the first (initial) UK GDP estimates from the Office for National Statistics against the subsequent (revised) data. Clearly there are times when the two series show very different trends, especially in the early years (more recent data are of course still subject to revision).
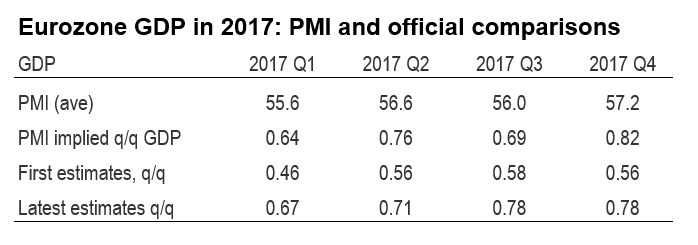
Data quality concerns are by no means confined to the UK, and a recent example of inaccurate eurozone GDP was seen in 2017. A marked divergence between GDP and PMI numbers fueled specualtion that the latter were sending misleading signals. The PMI numbers were showing considerably faster euro area economic growth than was being indicated by the official GDP data. However, revisions to the official data mean that we can now see that the PMI was in fact accurately prescient in predicting impressive GDP growth in 2017.
For example, the first official estimate of eurozone GDP for the first quarter of 2017 of 0.46% has subsequently been revised up to 0.67%. Second quarter growth has also been revised from 0.56% to 0.71%. Similarly-large upward revisions were seen in the second half of that year.
Using a regression to derive implied quarterly GDP growth rates from the PMI (as similarly prescribed by a European Central Bank staff research paper), the survey data indicated an average quarterly GDP expansion in 2017 of 0.74%, which compares with an average of 0.73% seen in the revised GDP numbers (against an average initial estimate of 0.54%).
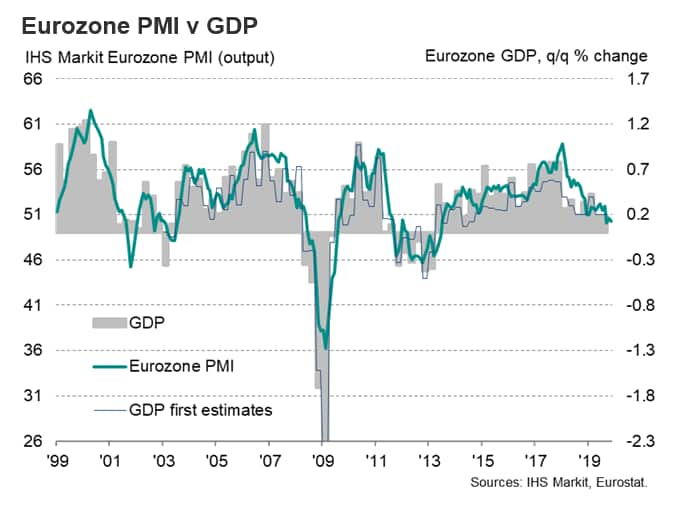
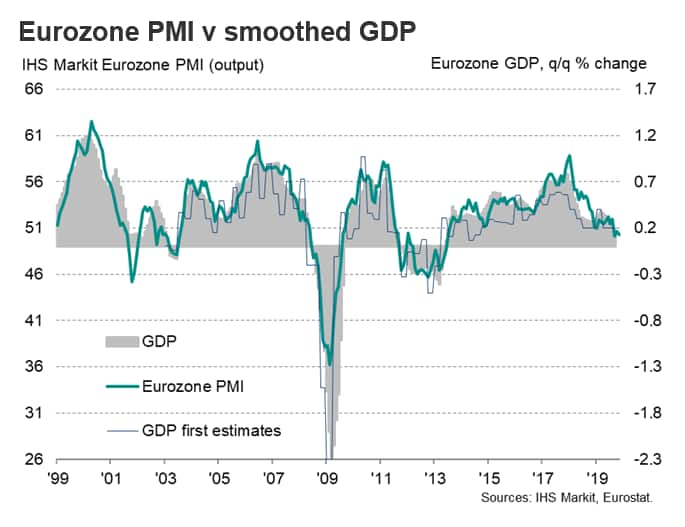
In the case of the Eurozone PMI, the composite output index (measuring output changes across both manufacturing and services) has exhibited a correlation of 0.80 with quarterly eurozone GDP growth. The correlation rises to 0.90 if a two-quarter moving average of GDP is used to remove some of the volatility in the official data.
Detecting the trend
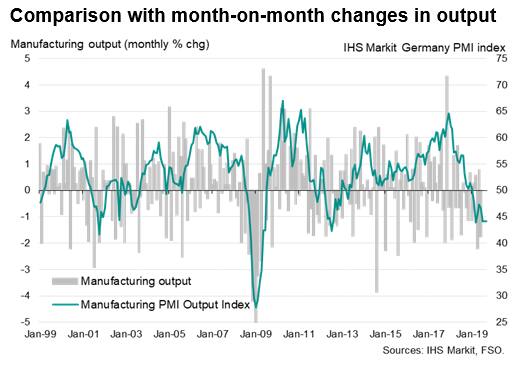
The fact that official data often show considerable volatility means it is sometimes difficult to assess the all-important underlying trend in the data. Some sort of smoothing process frequently needs to be applied before any trend can be observed in the data. This can be achieved by using a moving average of the data, or by looking at quarterly or annual percent changes rather than month-on-month movements. The PMI survey data do not tend to be as volatile as the official data, but instead tend to 'cut-through' the noise of the official data.
This means that the survey data may exhibit a relatively low statistical correlation with volatile month-on-month changes in many data series, but this is in fact an advantage of the surveys, as they instead give insight into the underlying trend, which audiences such as policymakers see as more valuable.
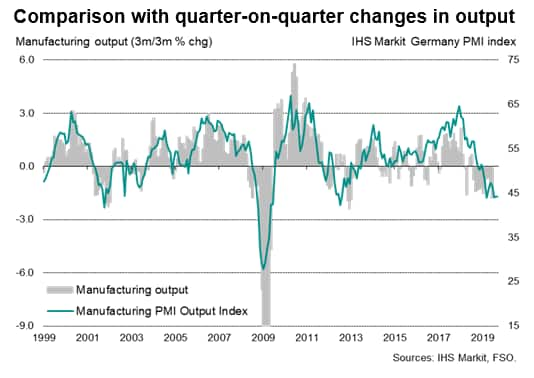
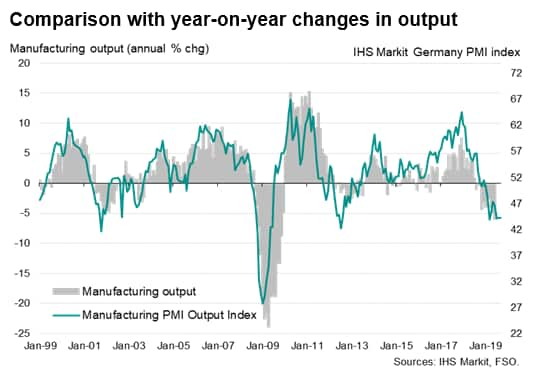
Correlations of the PMI with a three-month-on-three-month rate of change in the official data will consequently be much higher than the month-on-month change, and correlations with annual rate of change even higher.
This is demonstrated in the charts below, which plots the German manufacturing PMI output index against various different growth rates of official data, starting first with month-on-month changes.
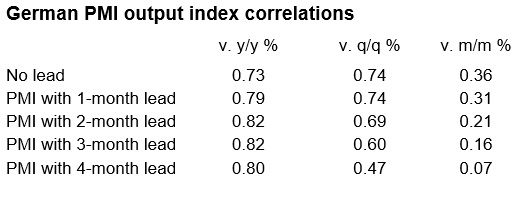
The table below shows the correlation of the PMI against official data also tends to improve with the PMI acting as a lead, in the case of German manufacturing rising to 82% when the PMI acts with a two- or three-month lead against the annual rate of change in the official data.
We would argue that it is of little importance that PMI survey data often have a low correlation with month-on-month changes in official data that can be as volatile as industrial production numbers. However, the fact that the PMI exhibits a very high correlation with the trend in the official data, acting in advance of the official data by several months, is a feature which makes the PMI surveys extremely valuable as an economic indicator for policymakers, investors and businesses.
Fact not sentiment
One widely held misconception about the PMI surveys is that the results reflect business sentiment. This is not the case. The questionnaires ask companies to report on hard business metrics at their firms relating to real-life variables such as output volumes, new orders, employment and prices. The above example of 2017 is just one illustration among many of how the PMI can be falsely described as a sentiment indicator just because it differs from what people misconceive to be the reality at that time.
Instead, because the PMI surveys collect factual data with high response rates from representative panels of senior executives that are very engaged in the survey process, the surveys provide advance insights into what's happening in the real world. Some further examples are provided in the appendix on pages 4 and 5 if you download the full report.
Chris Williamson, Chief Business Economist, IHS Markit
Tel: +44 207 260 2329
chris.williamson@ihsmarkit.com
© 2019, IHS Markit Inc. All rights reserved. Reproduction in whole
or in part without permission is prohibited.
Purchasing Managers' Index™ (PMI™) data are compiled by IHS Markit for more than 40 economies worldwide. The monthly data are derived from surveys of senior executives at private sector companies, and are available only via subscription. The PMI dataset features a headline number, which indicates the overall health of an economy, and sub-indices, which provide insights into other key economic drivers such as GDP, inflation, exports, capacity utilization, employment and inventories. The PMI data are used by financial and corporate professionals to better understand where economies and markets are headed, and to uncover opportunities.
This article was published by S&P Global Market Intelligence and not by S&P Global Ratings, which is a separately managed division of S&P Global.
