High Yield Energy Debt Running out of Gas
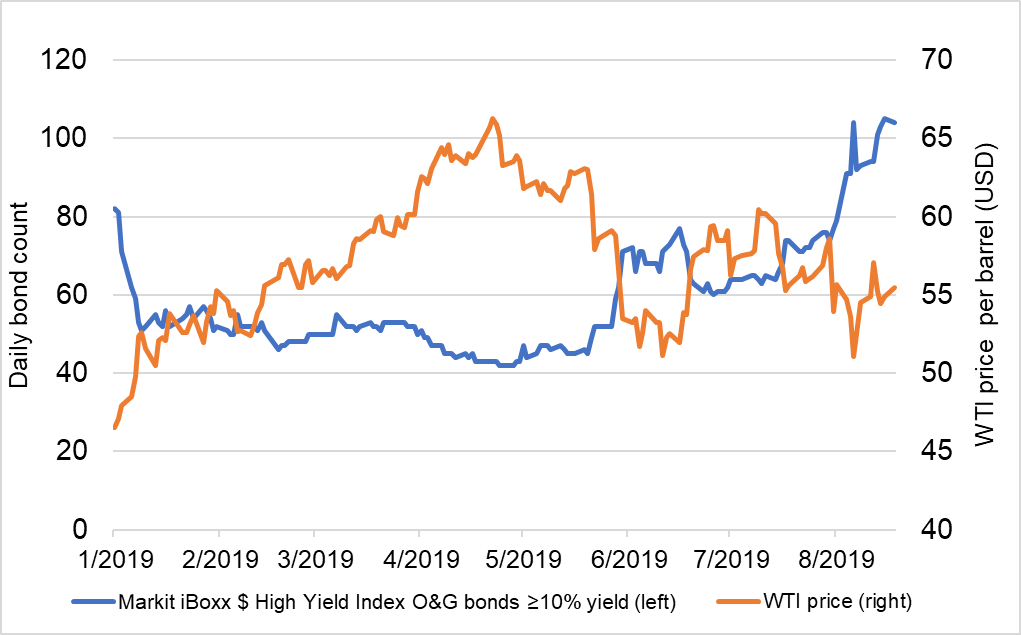
The oil and gas high yield debt markets continue to deteriorate despite the sharp decline in rates triggered by central bank actions, as piercing the critical $50-$55 per barrel West Texas Intermediate (WTI) crude oil level that many companies budgeted against this year looks more likely in the wake of a global economic slowdown. WTI prices began this year slightly higher than $45/barrel, which was near an almost three year low, which was driven this time by a pessimistic outlook for oil demand in the wake of a global slowdown and the surge in supply caused by the combination of the United States' unexpected issuance of Iranian oil sanction waivers and a ramp up in oil production ahead of the sanctions deadline.
WTI prices gradually recovered to a 2019 high close of $63.91 on April 30 according to data from IHS Markit's Energy group, which also coincided with the peak of the credit markets this year, as the announcement of the breakdown of US/China trade negotiations that followed a few days later triggered gradual risk aversion that increased significantly on August 5 when the Chinese Yuan breached ¥7.00/USD for the first time since May 2008. The credit market impact of the devaluation was further exacerbated by the inversion of the 10- and 2-year US treasury yield curve the following week.
The month of August is also showing a sharp increase in risk premium for US dollar denominated high yield debt, as indicated by the chart below which shows the daily count of a static pool (includes only bonds that were in the index every month through August) of Markit iBoxx USD High Yield index oil & gas constituents with 10% or higher market yields. This year's high of 105 issues with ≥10% yield was recorded on the August 16 and only one issue from that day has dipped below 10% as of the August 19 close.

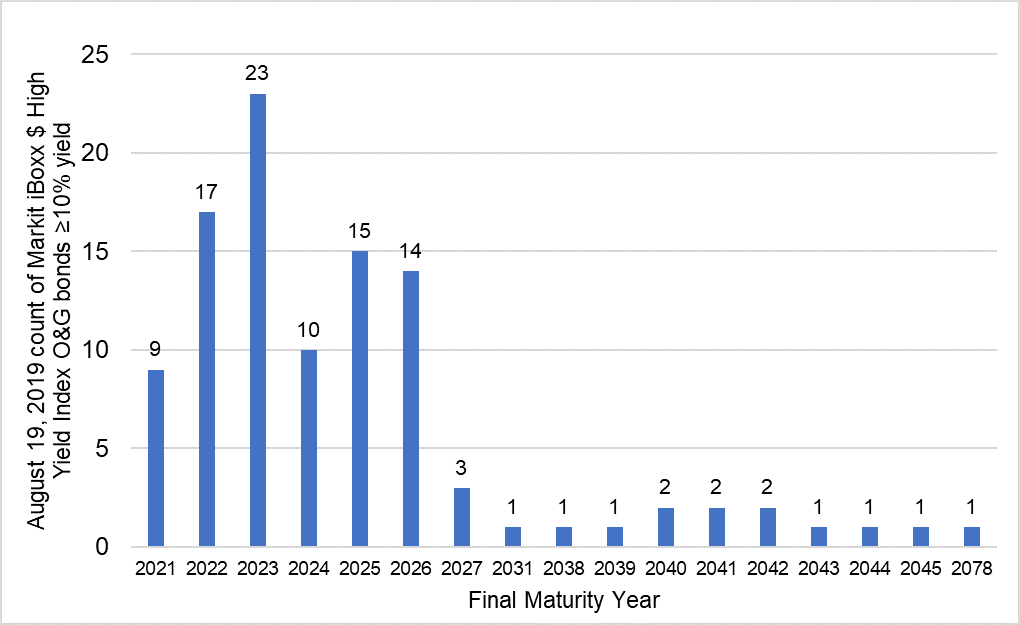
A 10% yield threshold is particularly important, as the cost of capital for a US exploration & production or an integrated oil & gas company is approximately 8-9%, so exceeding that level could make refinancing debt particularly difficult. Less excess cashflow from lower oil prices is particularly concerning ahead of the 2022 oil & gas sector maturity wall where Standard and Poor's estimates approximately $32 billion of all speculative grade debt in the sector will be maturing. The below chart shows the count of Markit iBoxx USD High Yield index oil & gas constituents trading at yields ≥10% as of August 19, with 17 issues maturing in 2022 and a particularly high concentration of 23 issues maturing in 2023.

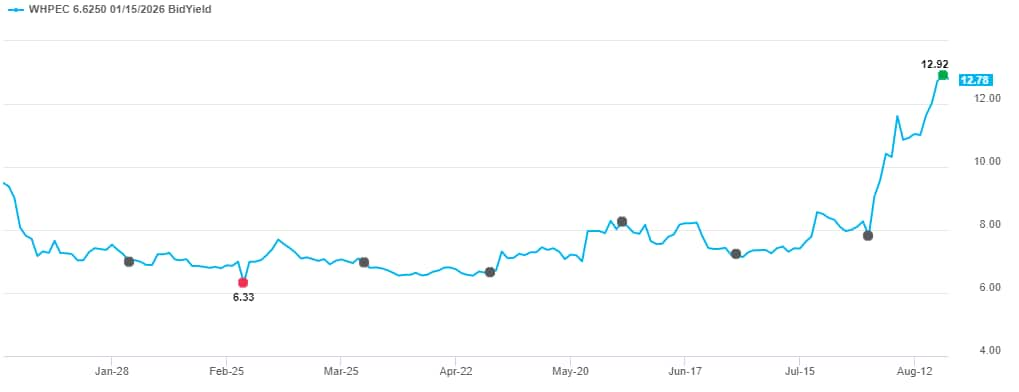
Whiting Petroleum Corporation 6.625% 1/2026 is among the bonds that recently breached a 10% yield and is also the most widely held bond among the 104 bonds as of August 19, with data from Ipreo by IHS Markit indicating that it is currently held by 212 investment funds. IHS Markit's Price Viewer shows below that yields on the issue first broke through a 10% yield on August 5 since closing at its best yield of the year of 6.33% on February 28.

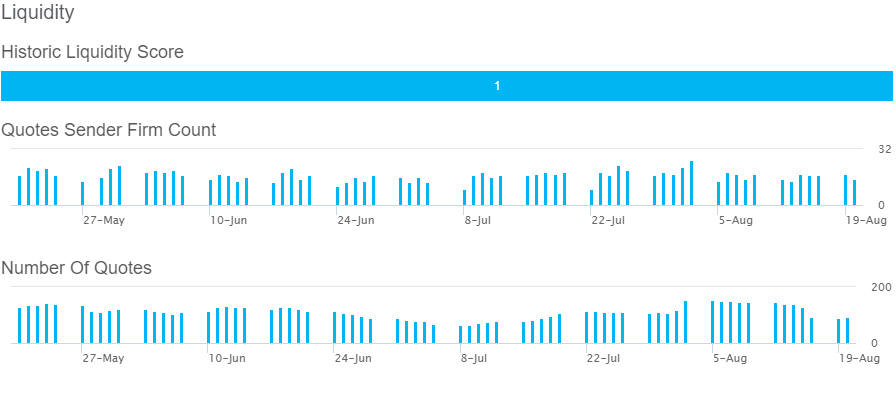
Many often confuse distress with liquidity, but data on the same Whiting Petroleum issue indicates the bond has had an IHS Markit liquidity score of 1 (1-5 score, with 1 the highest), which represents a relatively deep and transparent market for the bond despite the gradual decline in price. The below Price Viewer liquidity metrics on the issue show that between 15-20 dealers have been quoting the bond daily since late-May, with a surge to 26 dealers quoting on August 2 before the sharp increase in yield that followed on the next trading day. In addition, the bond was quoted over 140 times per day during the week of August 5.

There are many factors that can improve the outlook for debt in oil & gas sector like an increase in oil prices driven by better than expected demand due to a slower than expected deterioration in the global economic outlook and/or some form of intentional or inadvertent supply disruption. Time will tell if the recent price action in the O&G sector will be a canary in the coal mine that indicates the beginning of the end of the current credit cycle.
S&P Global provides industry-leading data, software and technology platforms and managed services to tackle some of the most difficult challenges in financial markets. We help our customers better understand complicated markets, reduce risk, operate more efficiently and comply with financial regulation.
This article was published by S&P Global Market Intelligence and not by S&P Global Ratings, which is a separately managed division of S&P Global.
