IHS Markit Fair Value Case Study: 2019 Istanbul/Karachi Stock Exchange Holiday in Observance of Eid al-Adha
IHS Markit Fair Value in Review
The Istanbul and Karachi Stock Exchanges were closed from August 12 - August 14 for Eid Al-Adha. In the absence of readily available quotes for Turkish and Pakistani securities during this holiday, IHS Markit provided fair value prices for the securities to enable investors, primarily mutual funds with Turkish and/or Pakistani exposure, to accurately calculate their net asset values (NAV). This ensures that long-term investors in the fund benefit from the most accurate share price possible.
IHS Markit Fair Value Results
Throughout the Middle Eastern holiday, IHS Markit continued to provide fair value prices for 200+ Turkish and 150+ Pakistani securities that were calculated using patent-pending multi-factor methodology. Global, regional and sector, and entity-specific factors were used to indicate macro and micro level risks. The most common input factors from IHS Markit included:
Turkey:
- iShares MSCI Turkey ETF
- Turkish ADRs
- S&P Futures
- Currency TRY.USD
Pakistan:
- Global X MSCI Pakistan ETF
- MSCI Emerging Markets Asia Index Futures
- Currency PKR.USD
- Pakistani ADRs
Table 1 highlights average directional correctness, closer to open and arbitrage reduction for IHS Markit's Turkish universe respectively during the exchange holiday. The tables further showcase these accuracy statistics across securities of varying market caps.
Table 1: Average Accuracy Statistics for Turkey securities (August 12-August 14)

Table 2 highlights average directional correctness, closer to open and arbitrage reduction for IHS Markit's Pakistani universe respectively during the exchange holiday. The tables further showcase these accuracy statistics across securities of varying market caps.
Table 2: Average Accuracy Statistics for Pakistan securities (August 12-August 14)

Total Market Cap of BIST 30 Index and KSE 30 Index in Aggregate
During the three-day holiday, global stock markets seesawed on the back of recession fears, inverted yield curves, slowing global economies and worries about the ongoing international trade war between the US and China. Markets in the US were down on August 12, recovered some losses on August 13, and then had the biggest one-day selloff of 2019 on August 14. Our multi-factor model captured these broad market movements along with the negative currency and country level movements to successfully fair value the components of the Bosra Istanbul 30 index (BIST 30) and the Karachi Stock Exchange 30 index (KSE 30), and to capture a large portion of the aggregate movement.
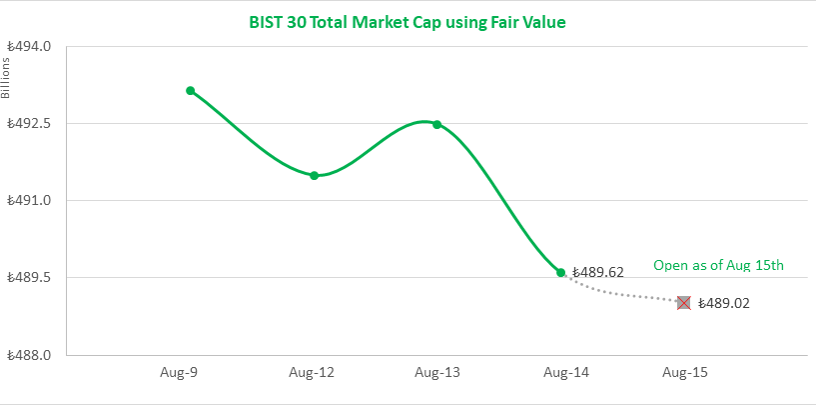
Chart 1 below tracks the change in aggregate market cap of the BIST 30 index through the market closure. By the end of Friday August 14, IHS Markit reduced the total market cap by ₺3.53 Billion, capturing 86% of the total movement.
Chart 1: Total Market Cap change of BIST 30 through the holiday

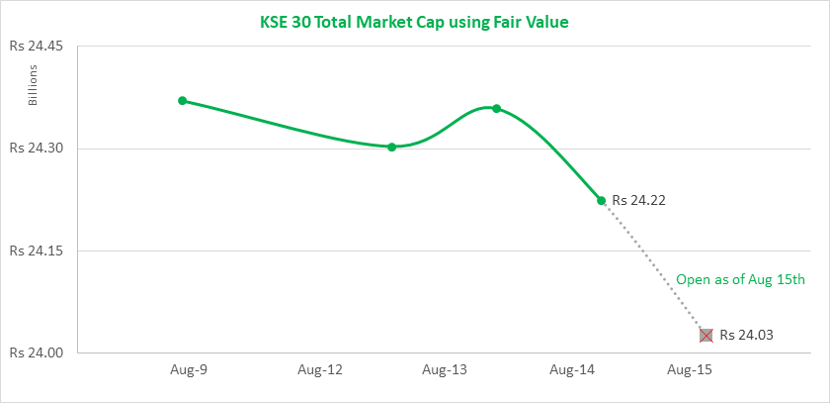
Chart 2 below tracks the change in aggregate market cap of the KSE 30 index through the market closure. By the end of Friday August 14th, IHS Markit reduced the total market cap by Rs 0.15 Billion, capturing 42% of the total movement.
<span/>Chart 2: Total Market Cap change of KSE 30 through the holiday

Significant movement captured for Large Movers
Country ETFs are important factors in accurately determining fair value, especially during extended holidays. During this market close, Economic fears fueled market declines around the world, and these sentiments were reflected in the iShares MSCI Turkey ETF and Global X MSCI Pakistan ETF returns. Tables 3 and 4 highlight the use of these factors in our models that enabled us to capture large portions of significant negative returns for Turkey's and Pakistan's respective securities.
Table 3:Fair Value Results for Turkey securities for August 14, 2019

Table 4:Fair Value Results for Pakistan securities for August 14, 2019

Appendix
The Directional Correctness metric is the percentage of fair value prices that moved in the same direction as the next day's open in relation to the previous day's closing price.
The Closer to Open metric is the percentage of fair value prices that were closer to the next day's opening price than was the previous day's closing price.
Arbitrage Reduction is the percentage of overnight movement captured, and the calculation is defined as follows:

Market Cap Calculations: To represent the components of the BIST and KSE indices, we used shares outstanding multiplied by either the close, fair value, or open price of a security. The result of this is an individual security's market cap at a given time. The sum of the securities' market caps within each index gives the total market cap at a given time. Domestic currencies were used for all calculations.
Related Reading
IHS Markit Fair Value Case Study:
Japan Golden Week, April - May 2019
Blog Post: The Value of Fair Value Beyond Compliance - February 2019
Fair Value Pricing Case Study: Istanbul Stock Exchange Closure - August 2018
Contact the Fair Value Team: MK-FixedIncomePricingBusinessDevelopment@ihsmarkit.com
S&P Global provides industry-leading data, software and technology platforms and managed services to tackle some of the most difficult challenges in financial markets. We help our customers better understand complicated markets, reduce risk, operate more efficiently and comply with financial regulation.
This article was published by S&P Global Market Intelligence and not by S&P Global Ratings, which is a separately managed division of S&P Global.