IHS Markit PMI and air freight demand compared
IHS Markit PMI surveys are often used to predict official economic data, such as GDP and inflation. The timeliness of PMI data1 means policymakers and analysts have very up-to-date information when assessing the state of the economy.
However, PMI surveys can also provide early insights into demand at industry level, as illustrated by the following analysis of air transport and air travel.
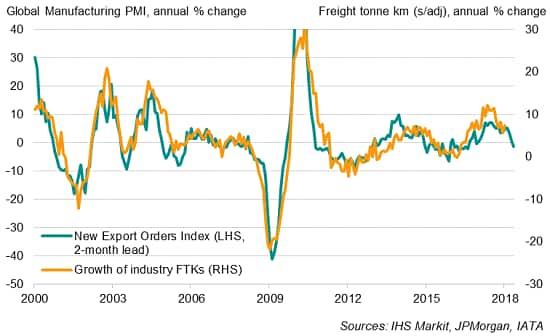
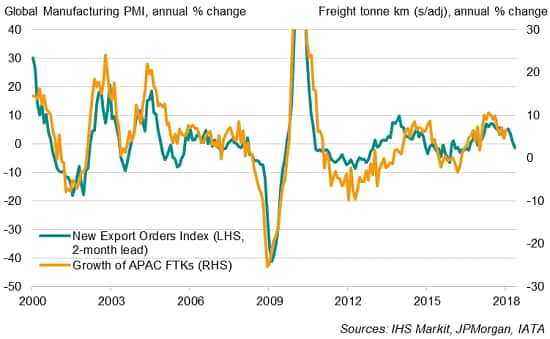
The New Export Orders Index of the JPMorgan Global Manufacturing PMI™ has a high correlation of 85% with the annual change in growth of air freight demand as measured by freight tonne kilometres (FTK2) with the PMI acting with a two-month lead (see chart 1). A similar relationship is seen when compared with air freight demand of carriers based in Asia Pacific (chart 2). Both comparisons highlight how PMI surveys act as reliable advance indicators of demand changes in air cargo transport.
Chart 1: Global PMI v air transport demand (FTK*)
Chart 2: Global PMI and APAC FTK growth
Slowing air freight growth
The latest business surveys suggest that global FTK growth could moderate in coming months. The New Export Orders Index from the March global manufacturing PMI surveys is broadly consistent with FTK growth easing to below 5% by April, slipping further from double-digit growth in late-2017. With Asia Pacific (APAC) carriers accounting for nearly 40% of global market share, FTK growth of APAC airlines is also likely to slow.
Air freight is more expensive as a cargo transport mode compared to land or sea, but also much faster. As such, signs of increasing strain on supply chains during an economic upturn are usually beneficial to air freight operators because speed of delivery becomes more important when firms seek to quickly rebuild inventory and source components to meet rising production requirements.
- PMI surveys are published well in advance of official economic data
- Data on air freight and air passengers are provided by International Air Transport Association (IATA)
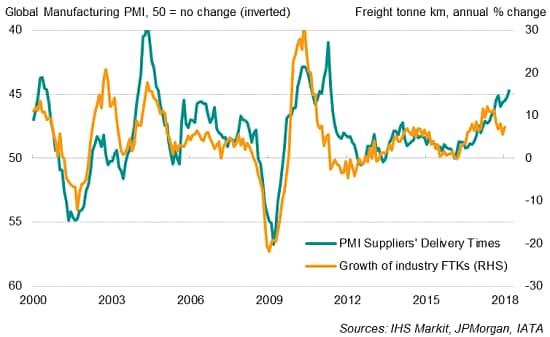
The PMI data in fact confirm that periods defined by faster economic growth and longer supplier delivery times are generally accompanied by rising demand for air transport. However, that relationship appeared to have decoupled since the fourth quarter of 2017 (chart 3). This decoupling can be explained by anecdotal evidence from PMI surveys, which revealed that supply shortages of basic, often bulky, raw materials such as industrial metals and paper contributed to delivery delays around the world. These commodities are not usually transported by air.
Chart 3: Supply chain pressure and FTK growth
Air passenger demand
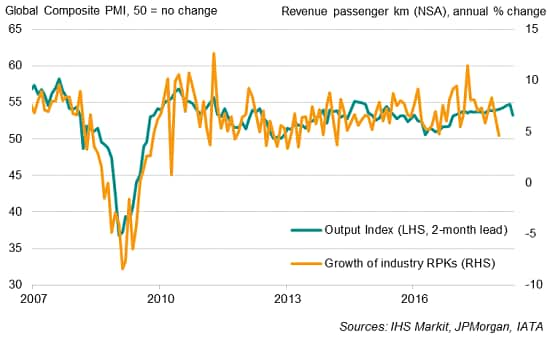
The survey data can also be used to anticipate changes in air passenger numbers. The JPMorgan Global Composite Output PMI™ has proved to provide accurate advance signals of air passenger demand growth. The PMI data exhibits an 83% correlation with air passenger volumes as measured by revenue passenger kilometres (RPK) with a two-month lead. Furthermore, the PMI data cuts through the noise to provide information about the underlying trend in air passenger traffic (Chart 4). March PMI data point to an annual growth rate of around 6-7% in RPK, and suggest that the recent downturn in RPKs is likely to prove temporary.
Chart 4: Global PMI v air passenger traffic
Bernard Aw, Principal Economist, IHS Markit
Tel: +65 6922 4226
bernard.aw@ihsmarkit.com
