Securities Finance: July 2020
- $907m in July revenues, +1.4% YoY
- US equity special balances decline sharply from peak
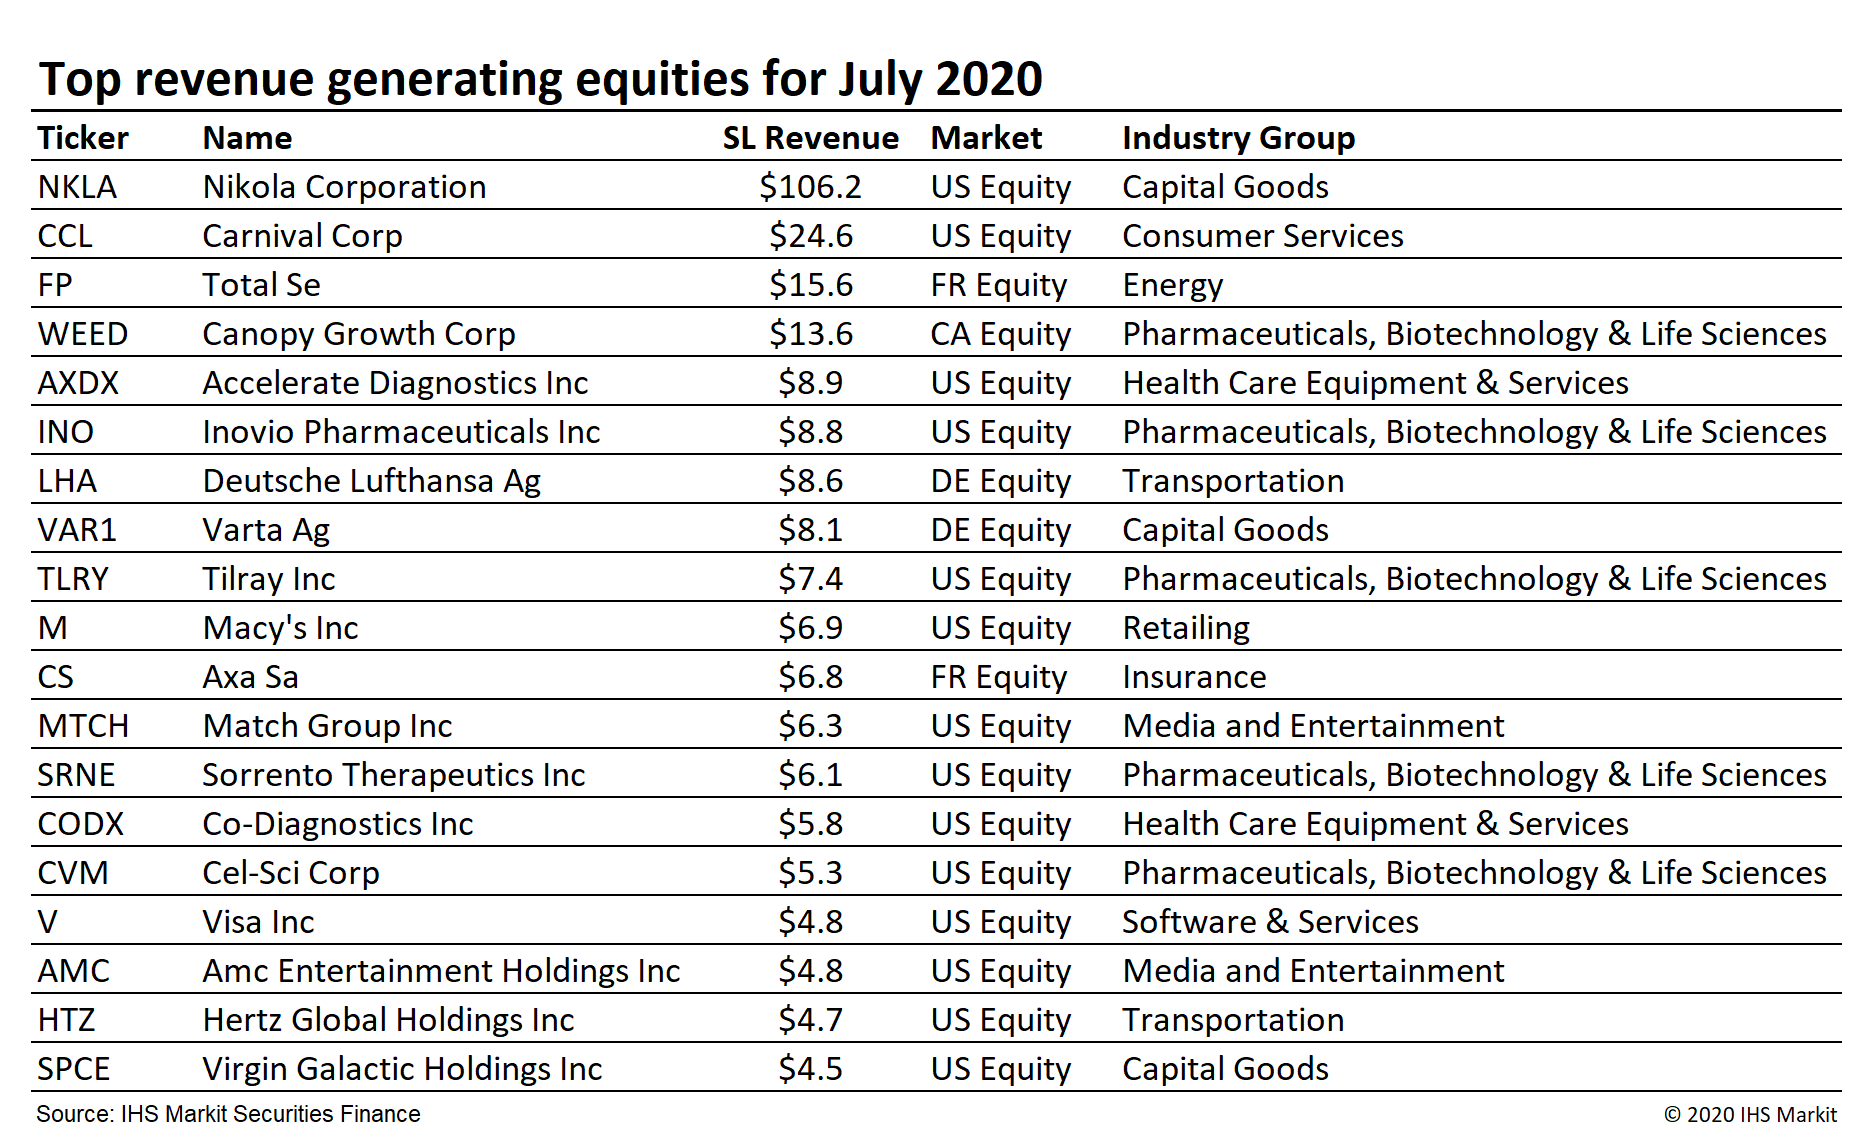
- Nikola Motors most revenue generating security of the month, $106m
- German equity specials deliver
Global securities lending returns increased 1.4% YoY in July. During the first half of 2020 securities finance trends emerged and receded rapidly; July presented a similar reversal of recently prevailing trends. Surging US equity special revenue was a defining characteristic of Q2, with on-loan balances increasing sharply as the broad market rally had an outsized impact on less liquid equities; That trend reversed in July as hard to borrow (HTB) shares underperformed and some arbitrage trades closed out. Similarly, total returns for fixed income lenders soared in Q2 as the result of Federal Reserve rate cuts along with increased borrow demand, which both widened fee spreads and increased reinvestment returns; Fee spreads and loan balances declined in July and reinvestment returns remained on downward trend from March peak. In this note we'll examine some drivers for securities finance borrow demand and lending revenue for July along with implications for the remaining five months of 2020.

July was the first month of 2020 to see a YoY increase in European equity lending revenue. There were a few drivers of the $141m in July revenue, a 21% YoY increase. To some degree the relative outperformance YoY in July could have been anticipated, based on dividends which were delayed into the month which otherwise would have fallen in Q2. In addition to the shift in seasonal demand, a handful of equity specials did emerge which also contributed to YoY revenue growth. German equity revenues continue to be robust despite Wirecard no longer appearing on the top revenue generating securities; Deutsche Lufthansa Ag and Varta Ag were among the top 20 most revenue generating securities in July and combined for 48% of German equity lending revenue. For all of Europe equity lending revenues are down 29% YTD through the end of July.

Americas equity revenues came in at $436m for June, a 13% YoY increase; The $2.3bn YTD total reflects an increase of 25% YoY. US equity revenues exploded higher in June, led by a handful of specials, however the broad short squeeze in hard-to-borrow shares had the knock-on impact of increasing special balances broadly. The increased special balances persisted into July; however daily revenue declined steadily during the month. US equity revenue for July came in at $396m, a 22% YoY increase, however it's worth noting that the last week of the month had the lowest revenue for any week since the last week of April.
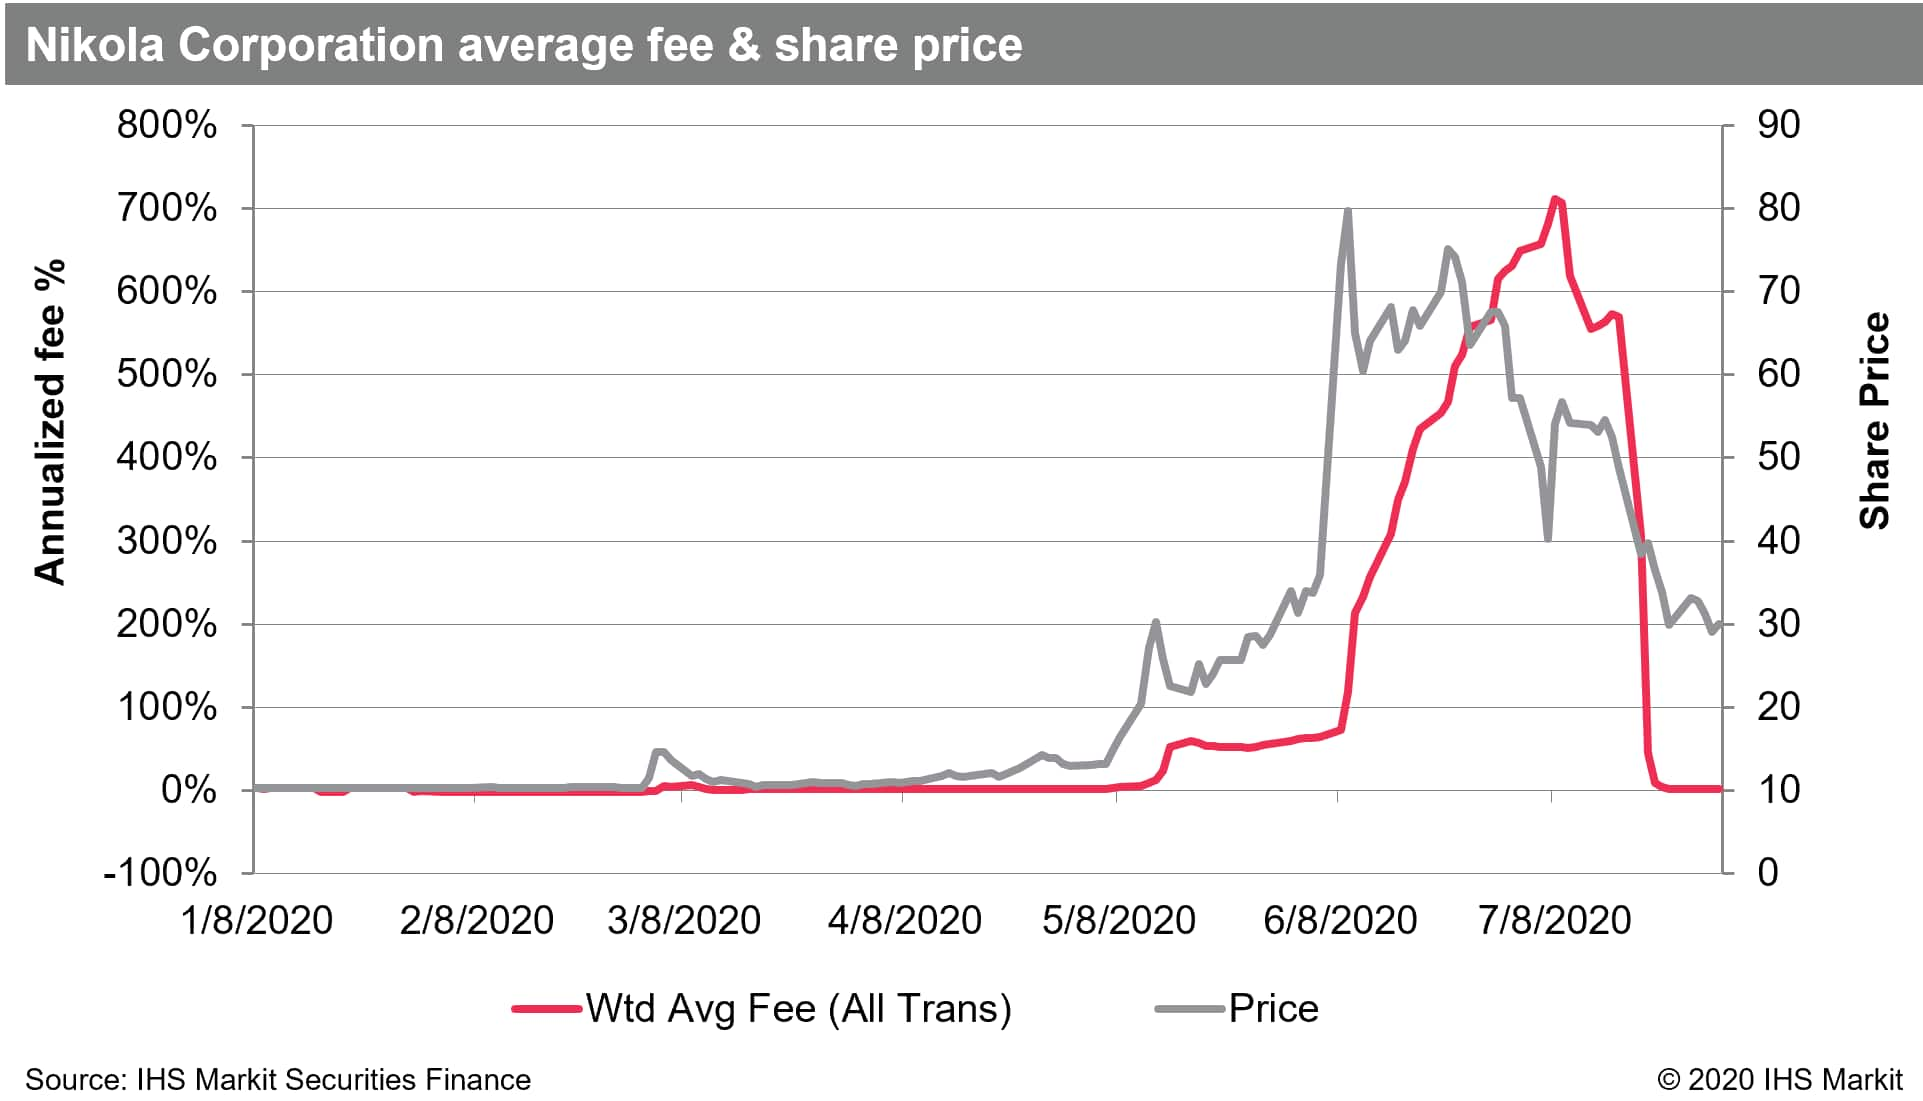
SPAC arbitrage continues to be a driver for US equity special balances; Nikola Motors delivered $106m in July revenues on the back of eye-popping fees in late-June and early-July ahead of the increased liquidity provided by warrant conversion, the most for any security globally. While the SPACs have certainly garnered their share of headlines, other corporate actions which drive borrow demand such as M&A and convertible issuance continue to bolster lending returns as the market continues to rally. Match Group Inc was a particularly remunerative example, generating $41m in June revenue in front of the completion of the spin-off from former parent company IAC on July 1st; The conclusion of the trade, which had $3.6bn in average balances for June, was a contributor to the July decline in US equity special balances.

Canadian equity lending had $39m in July revenues, a 33% YoY decline (or a 15% MoM decline compared with June). Declining revenue from lending HTB shares was the primary culprit for revenue decline, with July average fees declining 31% YoY, while on-loan balances only declined by 4%.
Asia equity lending revenues remain subdued, with July revenues of $118m reflecting a 23% YoY decline. The largest market, Japan equities, delivered $44m in July revenues, broadly in line with the Q2 average monthly return; YTD revenues of $347m reflect a 25% YoY decline compared with the same period in 2019. Hong Kong equity lending revenues have been steady at just over $30m per month since May, with July revenues of $31.2m reflecting a 31% YoY increase. The upswing in HK returns which started in May has been broad based with a handful of HTB equities leading in roughly equal measure, while overall balances and fees have grown YoY. The YTD returns for HK equities are still down 14%, owing to substantial shortfall over the first four months of the year. Australia equity returns for July declined by 16%, entirely the result of lower on-loan balances, while average fees have shown a YoY increase for each month since April. The short sale ban in South Korea has limited lending revenue, with $14.9m in July revenue being the lowest for any month of 2020 and reflecting a 54% YoY decline.
Global ETF revenues were $31.8m for July, a 27% YoY increase, however it is also the lowest monthly revenue for the asset class since February. The lower returns relative to Q2 are the result of declining on-loan balances, however both metrics remain elevated compared with pre-COVID levels. The top five most revenue generating funds are illustrative of overall demand, with iShares Russell 2000 fund first (IWM) and the SPDR S&P 500 fifth (SPY), with three China focused funds in the between them. Global ETF utilization in July extended the trend lower from the March peak, as borrow demand failed to keep pace with the growth in lendable assets.
Corporate bond lending revenues continue to fall short of 2019 comparison, mostly as the result of fees declining 24% YoY, however balances have also declined by 8.6% YoY. Corporate lending returns came in at $35.3m for May, a 33% decline YoY. Central bank support for global credit has dampened borrow demand, however the market is bifurcated. In the high-yield space credit events are piling up, and bonds from some distressed issuers are generating elevated lending returns, however broad returns for the asset class were stellar in July, which may have kept a lid on broad borrow demand. The utilization of corporate bonds in lending programs continues to decline from the late-March peak; Lendable assets were 8% higher in July than March, while on-loan balances declined by 10% during that time.
Fee-based revenue for US government bond lending came in at $68m for July, a 5.5% YoY increase resulting from larger loan balances. From the peak revenue in April, the downtrend in spread returns for UST lenders has been steady, with July delivering the lowest monthly return since February. For beneficial owners, returns from lending US Treasury securities in 2020 have been substantially bolstered by reinvestment of cash collateral, however reinvestment returns have steadily trended lower since late March as well. Returns from lending European sovereigns were $38m for June, a 1.9% YoY increase as the result of slightly higher balances and fees. Global government bond fee-based revenues are up 10% YoY through July 2020.
Conclusion:
A substantial portion of the demand for the most revenue generating securities was driven by arbitrage trades of various types. While the durations of these trades vary, the increased corporate action related borrow demand appears likely to remain in place for the latter portion of 2020 as firms seek to optimize their operations for a rapidly changing corporate landscape.
After a challenging period for many equity short sellers from April to June, high-fee US equities underperformed relatively easy to borrow shares in July, generally a boon to long-short equity strategies. With that said it's worth bearing in mind for conversations about "short sellers", that convertible or SPAC warrant arbitrageurs will generally benefit most from an increase in share prices.
Global securities finance revenues increased 1.4% YoY in July however the trend is to the downside, with utilization steadily falling since March, reinvestment returns declining and US equity special balances heading back toward baseline trend after Q2 surge. Some of the key H1 drivers of lending revenues may be fading in Q3, however the reversals of trend have been rapid in 2020.
Our 2020 mid-year review is available here, as always stay tuned for monthly updates from IHS Markit.
S&P Global provides industry-leading data, software and technology platforms and managed services to tackle some of the most difficult challenges in financial markets. We help our customers better understand complicated markets, reduce risk, operate more efficiently and comply with financial regulation.
This article was published by S&P Global Market Intelligence and not by S&P Global Ratings, which is a separately managed division of S&P Global.