Securities Finance September Snapshot 2022
- Q3 was the highest revenue generating quarter of 2022
- Americas equity specials continue to dominate
- Government bonds see best revenues and highest fees of 2022
- Corporate bond revenues remain strong
Securities finance revenues totaled $1.028bln for the month of September. This was an increase of 5% YoY but a decrease of circa 11% on the month of August. On loan balances remained flat across all securities. Average fees increased 6% YoY but given the declines in global equity indices and bond prices over the month, a decrease in valuations is likely to have had an impact upon revenues. Utilization remained strong, increasing YoY across all asset classes. Revenues were down across all equity markets other than the Americas. Government bonds generated $168m over the month making both September and Q3 the best periods for the asset class. Corporate bonds continued their impressive run generating revenues of $83m which was a remarkable increase of 78% when compared with September 2021. In line with this increase were the average fees commanded for corporate bonds (+77% YoY) which increased 34% when compared with January.
Q3 was the highest revenue generating quarter of the year so far (Q1 $2.74bln, Q2 $3.361bln, Q3 $3.383bln). Securities finance revenues for 2022 to the end of September were $9.487bln.

Americas equity
Americas equity was the only equity market to witness an increase in revenues YoY. Balances, average fees, and utilization all increased in comparison with September 2021. Despite these increases, revenues were down approximately 26% when compared with August and 40% compared with July which was the highest revenue generating month of 2022 for the asset class. In line with the revenues the average fee was also down MoM by 22%. This decrease is even greater when compared with July (-37%).
Americas equity generated 49% of all equity revenues for the month which shows how important this market is in generating revenues for the equity asset class. Q3 was the highest generating month for Americas equities with revenues of $1.49bln ($1.25bln Q2 and $0.974bln Q1).
The top ten revenue generating stocks in the US collectively produced more than $118m over the month. The top earning name was 3M Co which generated 18% of these revenues alone. Since the beginning of the year the share price of 3M has declined 36% (Nasdaq -28%). The stock fell 5% during the month of September alone. The company is facing billions of dollars' worth of damages due to alleged faulty equipment (ear plugs) that was supplied to the US military. During the month a bankruptcy court rejected the company's appeal for protection against the product liability claims (worth $10s billions) and the stock has been a target of short sellers ever since. In addition, 3M also recently announced a tender offer to spin off it's food safety business. The terms of this offer have led to increased borrowing demand and higher fees as a result. Many of the other names in the top ten remain familiar when compared with previous months. Upstart Holdings remains in the list and has generated over $75m in borrow fees since the beginning of the year. The software company has had a volatile ride on the stock market since the beginning of the year with its stock price down over 85% since January. The dramatic, rapid rise of interest rates in the US has created issues for Upstart's business. Lucid Group, AMC, Beyond Meat and Gamestop remain the stalwarts of the top ten revenue generating stock list.

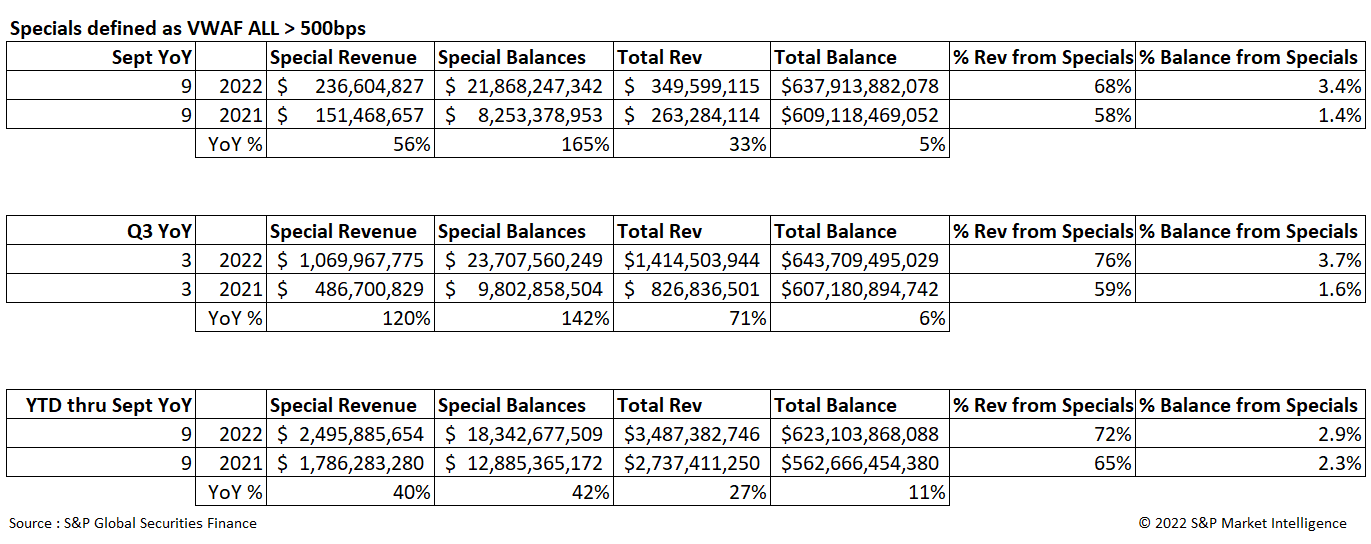
The US equity specials market has been particularly hot throughout 2022 and they have been a large contributor to overall revenues for the asset class. US equity specials revenue totaled $236m in September, a 56% YoY increase (specials defined as greater than 500bps volume weighted average fee). The revenue contribution from specials increased YoY, with 68% of US equity revenue delivered by specials in September compared with 58% in September 2021. The stellar results across Q3 pushed YTD US equity specials revenues to $2.5bn through September, an increase of 40% YoY relative to the same period of 2021.

APAC equity

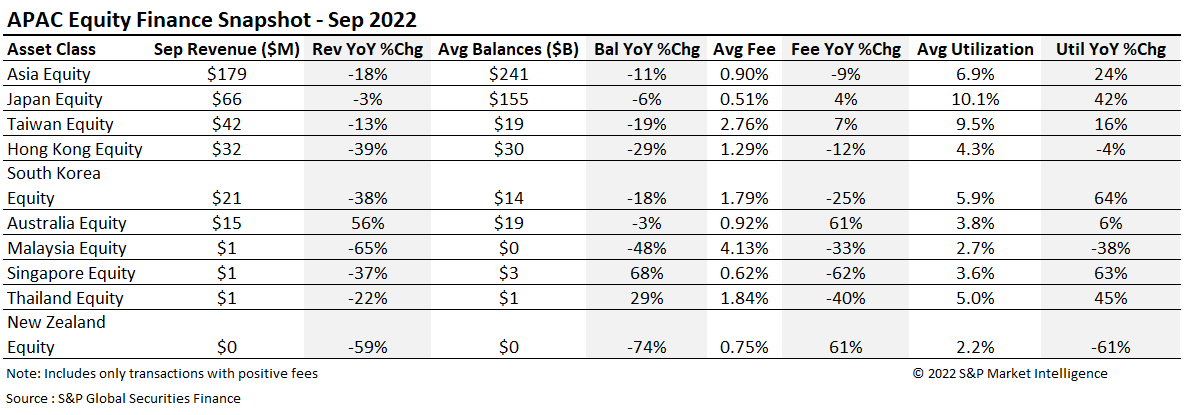
APAC equity suffered a 18% decline in revenues YoY. Despite this, September was the second highest revenue generating month (after March $205m) and revenues increased by 12% when compared with August. On loan balances increased 19% MoM but average fees fell by 4%.
Japan overtook Taiwan as the highest revenue generating market accounting for 37% of all revenues. Several Japanese equities made an appearance in the top 10 revenue generating securities for the month which has contributed to this overall figure. Utilization now stands in double digits in Japan for the first time this year.
Taiwan continues to produce strong returns for lenders with average fees increasing 7% YoY to an impressive 276bps. The recent announcement by the FSC to tighten short selling rules in this market by lowering the maximum number of securities that can be borrowed and increasing the margin requirements may dampen demand going into Q4.
Australia continued to shine in the Asian region generating $15m in revenues over of the month. This was 56% increase YoY and broadly aligned when compared MoM. Average fees also increased by an impressive 61% YoY. The mining and natural resource heavy country is seeing revived interest given ongoing discussions regarding environmental initiatives and the world's renewed focus upon natural resources following the war in Ukraine.
Revenues in APAC equities have remained evenly spread over the three quarters of 2022. Q3 was the second highest revenue generating quarter with $504.6m in revenues (Q1 $534.87m and Q2 $504.1m).
Wiwynn Corp remained the highest revenue generating equity over the month as technology and semiconductor companies continued to suffer from inventory issues. Shipping company Nippon Yusen saw its share price decline by 26% during September as interest rate increases across the globe raised concerns over the global economic outlook. The banking sector in Japan also came under pressure as the Japanese central bank intervened in currency markets to support the Yen against the US Dollar (JPY -22.92% vs USD since January).

Europe equity

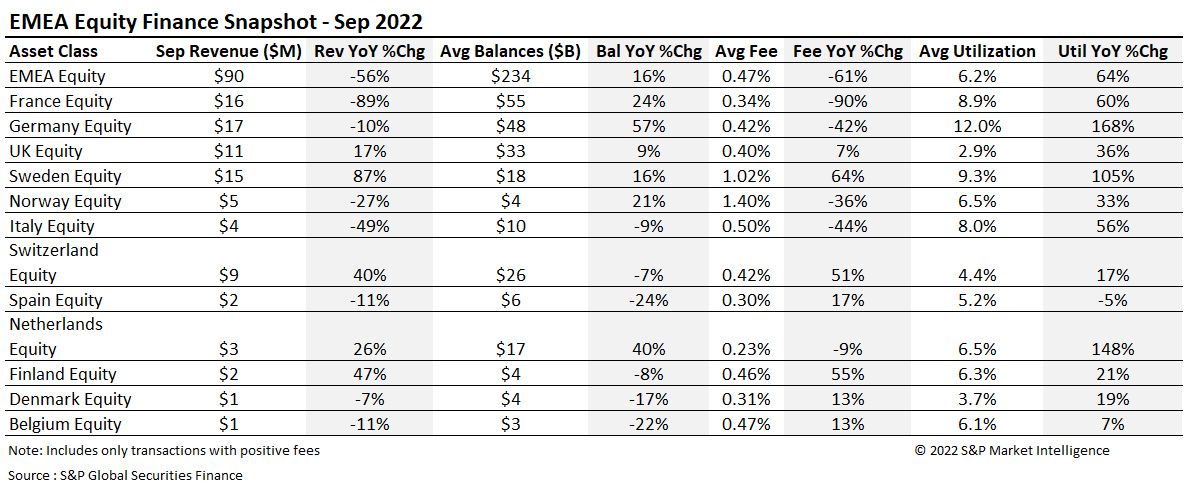
European equities generated $90m in revenues during the month of September. This was a decrease of 56% YoY and 12% MoM. Despite this, balances grew by 16% YoY, and utilization increased by 64% YoY. Germany remained the highest revenue generating market and accounted for 19% of all revenues. Varta AG, the most notorious ongoing special in Europe, accounted for 23% of this. Many of the same trends that have been present throughout the year in Europe persisted. Sweden continued to see impressive returns YoY. SBB B, the property company, continued to attract a lot of demand. The rising interest rate environment is perceived as a strong threat to the financial viability of the company's operations. SBB B accounted for 20% of all revenues in Sweden during the month.
Revenues generated in the UK accounted for 12% of all European equity revenues during September. The $11m generated represents a 17% increase YoY. Average balances increased 9% YoY and average fees also increased 7% to 40bps. Utilization, despite increasing 36% YoY, remains significantly below France (8.9%) and Germany (12%).
Q3 was the second highest revenue generating period for European Equities. During Q3 $296.1m was generated versus $574.6m during Q2 and $276.3m during Q1. Given the cyclicality of on loan balances in Europe this is unsurprising. Average fees during Q3 were 1bps higher on average when compared with Q1 at 0.49%. On loan balances fell 20% in Q3 when compared with Q2. This is roughly aligned with the decrease seen in European equity markets valuations over the same period (France -15.6%, Germany -20.2%, Italy -20.7%, Spain -11.7% and the UK -4%).
Total energies Se was the highest revenue generating European equity over the month. This coincides with the annual dividend on the 21st September (ex-date). Varta Ag remained the top short over the period. The stock has generated over $44m in revenues since January. Revenues generated from Varta Ag declined 33% during the month from $5.71m during August. Swedish stocks dominated the specials table during the month. SAS Ab generated $1.86m as the company faced downward pressure on its share price, sharing the same financial pressures as IAG.

ADR
ADR revenues continued to stage a fight back from the lows seen at the beginning of the year. Revenues during the month declined 22% compared to August but equaled those of July. Revenues increased 29% YoY and average fees increased an impressive 98% to 140bps. Q3 was the highest revenue generating quarter for ADRs ($103.2m), 44% higher than Q2 ($68.5m) and 51% higher than Q1 ($51.4m).
Polestar remains the top revenue generator amongst all the ADRs. The Electric Vehicle sector remains well represented in all the top revenue earning stock tables across all regions and asset classes. The Global X Autonomous and Electric Vehicles ETF closed down nearly 15% for the month of September, its second worst-performing month on record. The EV sector remains under pressure due to supply chain dislocations, recessionary fears and an increase in interest rates which is making the financing of new vehicles more expensive for consumers. COVID has pushed up the price of both new and secondhand vehicles in many countries across the globe creating affordability challenges for the consumer and bringing EV company share prices under pressure.

ETP
Despite it being widely reported that ETFs suffered large outflows during the month of September, ETPs generated $74m in securities finance revenues which equates to an impressive 43% increase YoY. As in previous months, American ETFs were responsible for the lion's share (88%) of the revenues followed by Europe (11%) and Asia (1%). When compared YoY all the metrics for ETPs remained positive. Growth was seen in revenues, average balances, fees and utilization. Revenues (+17%), fees (+20%) and balances (+1.2%) also increased when compared MoM.
Revenues during Q3 ($204m) were lower when compared with Q1 ($215.1m) and Q2 ($238.1m). Average fees during Q3 (76bps) increased when compared with Q1 (74bps) by 3% however, although Q2 saw the highest average fees of 83bps. Cumulative balances declined over the quarters leading to Q3 (Q1 $119.7bln, Q2 $115.5bln, Q3 $107bln).

Many of the top five revenue generators remain well documented from previous months. Given the volatility in the equity and fixed income markets, ETFs continue to provide a relatively easy instrument to reflect investors sentiment in individual sectors through directional trades. This is reflective in the table below which focuses on the high yield and equity indices. The S&P 500 closed down 11%, and the Russell 2000 closed down 9% over the month. Costs for issuers in the high yield space continue to increase given the interest rate rises by central banks, lowering prices and increasing yields.

Government Bonds
September proved a volatile month for government bond markets. Both the 10yr US Treasury and UK Gilt surged to a 4% yield for the first time since the financial crisis (March 2008). This increase in yields was one of the fastest in history. Two-year government bonds, which are more sensitive to interest rate changes, experienced an incredibly volatile month. Cash market liquidity was reported in the financial press to be poor as investors sat on the side lines waiting for calmer waters.
Despite the volatility in the cash markets, government bond activity in the securities finance market remained resilient. Revenues increased by 30% YoY to $168m. Average fees also increased an impressive 37% to 18bps reflecting a strong demand to borrow those issues experiencing the highest increases in yields. Year to date, Government bonds have generated $1.33bln in revenues. Q3 was the highest revenue generating quarter ($472.3m) followed by Q2 ($442.8m) and Q1 ($420.4m). This is reflective of the increase in interest rates and volatility throughout the year. Average fees have increased 23% over the year as a result.

Corporate bonds
The Bloomberg global bond aggregate which measures the prices of a basket of investment grade corporate bonds was down circa 20% over the month of September. Corporate bond prices continued to fall as inflationary concerns remained and central banks continued to increase interest rates. This has produced numerous directional opportunities and is a trend that has persisted throughout the year. Corporate bonds in securities finance programs are, as a result, experiencing one of their best years ever.
Corporate bonds generated $83m during September. Whilst revenues were down 4% MoM, they increased an impressive 78% YoY. Corporate bonds have now generated over $685m since January. Revenues have continued to grow over successive quarters with Q1 producing $204.9m, Q2 $231.6m and Q3 $250.8m. The average fee increased 77% over the year leading to the highest average fee so far in September (39bps). Corporate bond fees have increased 35% since January.
The top five revenue generating corporate bonds during September remained the same as those seen in August. The convertible bond Issued by Booking Holdings Inc continued to be the top earner. Private placements and convertible bonds continued to dominate the table.

Conclusion
September was a solid month for securities finance activity. Whilst revenues were down slightly when compared with August and July, they remained 5% higher than during September 2021. Americas equities and fixed income were the star asset classes of the month. The amount of revenue driven by specials (fee > 500bps) was the main source of revenues within Americas equities and contributed 68% of all revenues. The breadth of specials activity remains quite narrow, but these stocks continue to produce solid revenues and have done for several months. As Q3 earnings start to be reported, given the number of economic headwinds, this list of heavily borrowed stocks is expected to grow.
Fixed income assets remain heavily borrowed fueled by pricing volatility and central bank rate increases. Government bonds have had one of the most volatile trading months for years. All short-dated government bonds remain in demand. A general flight to quality will benefit this asset class further as interest rates continue to climb and fiscal and monetary policy, in certain jurisdictions, remain at odds with each other.
IHS Markit provides industry-leading data, software and technology platforms and managed services to tackle some of the most difficult challenges in financial markets. We help our customers better understand complicated markets, reduce risk, operate more efficiently and comply with financial regulation.
This article was published by S&P Global Market Intelligence and not by S&P Global Ratings, which is a separately managed division of S&P Global.
