US Flash PMI sees weakest order book growth since 2009
- Flash composite PMI™ rises only modestly in September to hint at weaker GDP growth in Q3
- Manufacturing recession likely extended into Q3, malaise spreads to services
- Jobs cut for first time since 2010 amid weakest order book growth since 2009
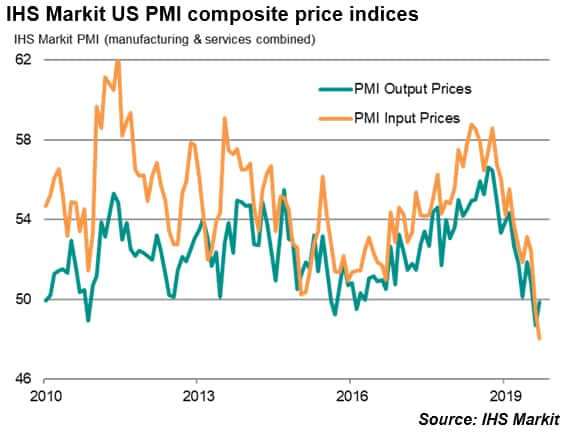
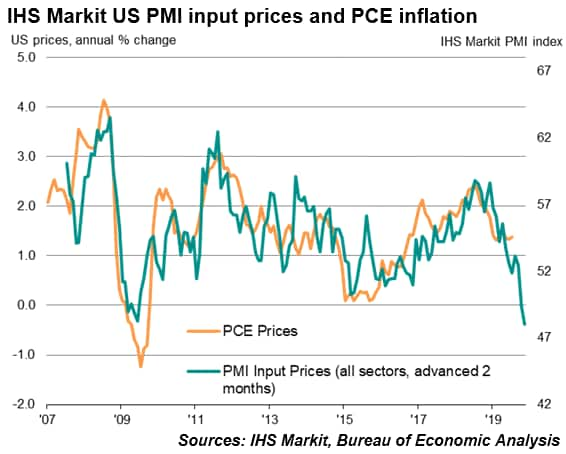
- Lowest price pressures for a decade
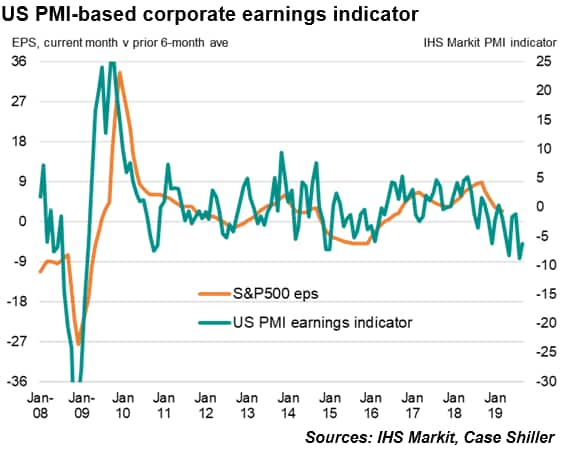
- Corporate earnings under increased pressure in Q3
- PMI in 'dovish' FOMC territory
Flash PMI survey data indicate that US businesses continued to struggle against the headwinds of trade worries and elevated uncertainty about the outlook in September. Growth in the third quarter has been the weakest for three years, causing firms to cut back on hiring. Price pressures have also fallen, dropping the lowest for a decade.
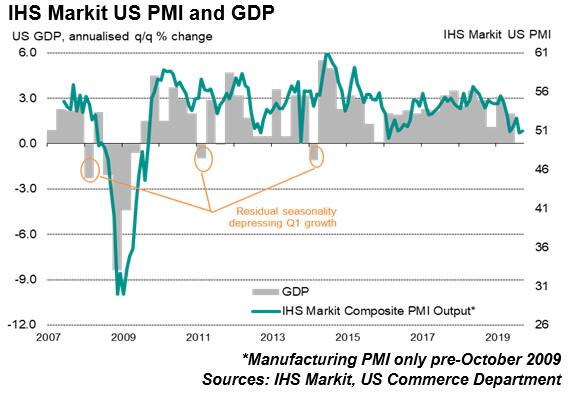
At 51.0 in September, up from 50.7 in the previous month, the seasonally adjusted IHS Markit Flash U.S. Composite PMI Output Index posted slightly above the crucial 50.0 no-change value. However, although picking up slightly, the overall rate of growth in September remained among the weakest since 2016, commensurate with GDP rising in the third quarter at a subdued annualized rate of approximately 1.5%.
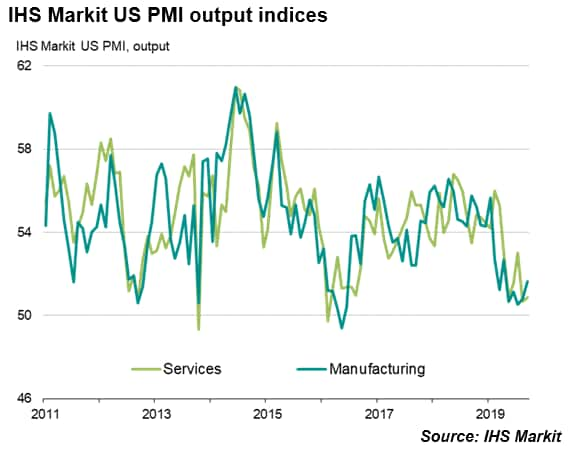
Key to the recent deterioration has been a further spill-over of the trade-led slowdown in manufacturing to the service sector. The service sector in fact grew at a slower rate than manufacturing for a second straight month in September, according to the flash PMI, rounding off its worst quarter for three years.
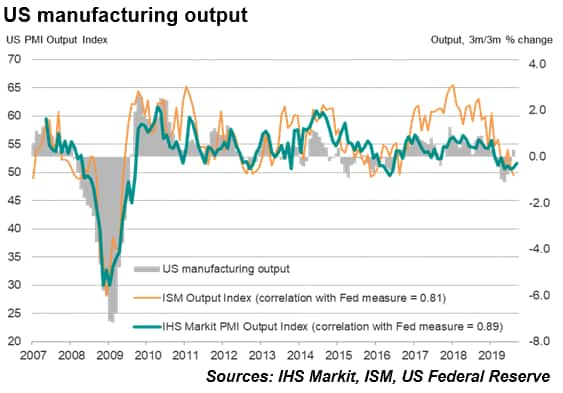
A ray of light came from manufacturing reporting some easing of headwinds, though factory conditions likewise remained among the toughest since 2009 to underscore the broad-based nature of the current lassitude. Comparisons of the survey's manufacturing output index with the official data from the Federal Reserve indicate that the survey remains consistent with the official measure of factory output remaining in decline in September, extending the sector's recession into a third quarter.
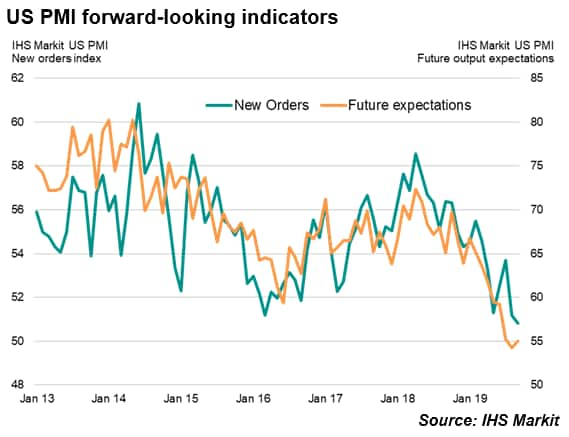
Prospects also look gloomy, with inflows of new business down to the lowest since 2009 and firms' expectations of growth over the coming year stuck at one of the most subdued levels since 2012. Inflows of new service sector business almost stalled in September to register the smallest rise since the survey began in 2009.
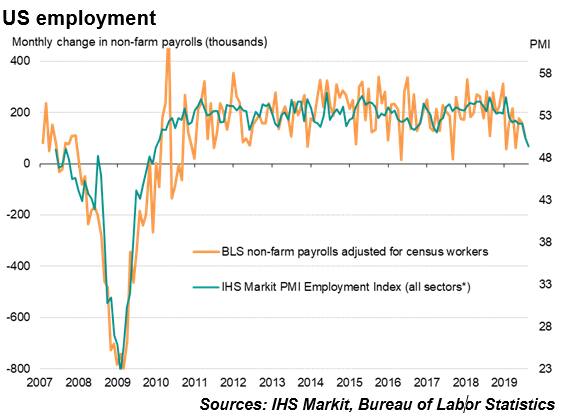
Disappointing inflows of new work and gloomy prospects for the year ahead took their toll on hiring again. Firms have become more risk averse and increasingly eager to cut costs, resulting in the September PMI showing jobs being cut across the surveyed companies for the first time since January 2010. At current levels, the survey employment index is indicative of non-farm payroll growth falling below 100,000. That compares with signals of an average of 200,000 in the first quarter and 150,000 in the second quarter.
Price pressures have meanwhile also eased, with both input costs and average selling prices for goods and services dropping for a second consecutive month in September (albeit with the latter down only very marginally), painting a picture of the lowest corporate inflationary pressures for a decade.
The weakness of order books alongside the recent drop in pricing power bodes ill for corporate earnings in the third quarter. To estimate the trend in earnings growth we have compiled an indicator based on five components, all derived from IHS Markit's US PMI surveys, which provide insights into sales growth, pricing power and profitability:
• Total order book situation: a blended index of the composite new orders and backlogs of orders questions providing an overall indication of sales growth (weight 1.3)
• Output prices: based on the composite PMI average prices charged index, providing an indication of pricing power among goods producers and services providers (weight 0.7)
• Backlogs of work: the composite survey index covering work received but not yet completed, helps indicate the extent to which demand is running ahead of capacity and therefore acts as a further guide to both sales and pricing power (weight 0.7).
• Productivity: the ration between composite PMI output and employment indicators which provides an insight into labour productivity, itself a key determinant of profitability (weight 0.2)
• Suppliers' delivery times: a key gauge of capacity constraints and pricing power (weight 0.3)
We compare the components against the reported earnings per share in S&P500 companies over the prior 12 months, as measured by Case Shiller, and specifically the current month's EPS value against the prior six-month trailing average. The average earnings growth momentum signalled by the indicator in the third quarter is the lowest recorded since the first quarter of 2009. However, please note that the indicator uses a scale based on standard deviations so units do not represent indicated changes in actual earnings and is merely designed to provide a simple guide to earnings trends.
Chris Williamson, Chief Business Economist, IHS
Markit
Tel: +44 207 260 2329
chris.williamson@ihsmarkit.com
© 2019, IHS Markit Inc. All rights reserved. Reproduction in whole
or in part without permission is prohibited.
Purchasing Managers' Index™ (PMI™) data are compiled by IHS Markit for more than 40 economies worldwide. The monthly data are derived from surveys of senior executives at private sector companies, and are available only via subscription. The PMI dataset features a headline number, which indicates the overall health of an economy, and sub-indices, which provide insights into other key economic drivers such as GDP, inflation, exports, capacity utilization, employment and inventories. The PMI data are used by financial and corporate professionals to better understand where economies and markets are headed, and to uncover opportunities.
This article was published by S&P Global Market Intelligence and not by S&P Global Ratings, which is a separately managed division of S&P Global.

