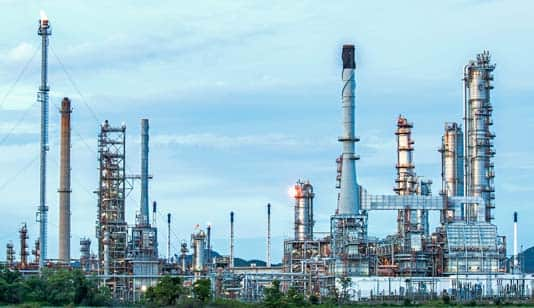
Chemical Competitive Cost and Margin Analytics
S&P Global Cost Curve Scenarios:
What would happen to the world cost curves for Ethylene and Polyethylene-HDPE if oil prices don’t rise to the S&P Global forecast?
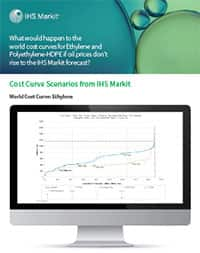
Expand to full infographic
By combining our global expertise with flexible functionality, S&P Global helps you answer these questions:
- How will new capacity additions affect the competitiveness of my existing operating plants?
- Who are the most cost advantaged and disadvantaged producers?
- Is my capital investment viable in the long-term?
- What is the feedstock cost advantage of an integrated plant?
- How will a shift in oil, feedstock or chemical prices impact competitiveness?
- I need to renegotiate contracts ─ what are the upstream and downstream cost structures in my value chain?
{"items" : [
{"name":"facts","url":"https://cdn.ihsmarkit.com/www/pdf/0422/SP-Global-Competitive-Cost-Margin-Analytics.pdf","enabled":true,"desc":"Download product information","alt":"Download product information","mobdesc":"PDF","mobmsg":"Download product information"},{"name":"login","url":"","enabled":false,"desc":"Product Login for existing customers","alt":"Login","large":true,"mobdesc":"Login","mobmsg":"Product Login for existing customers"},{"name":"sales","override":"","number":"[num]","enabled":true,"desc":"Call Sales [num]","proddesc":"[num]","alt":"Call Sales</br>[num]","mobdesc":"Sales","mobmsg":"Call Sales: [num]"}, {"name":"share","enabled":true,"desc":"<strong>Share</strong>","mobdesc":"Share","options":[ {"name":"facebook","url":"https://www.facebook.com/sharer.php?u=http%3a%2f%2fqa.www.spglobal.com%2fcommodityinsights%2fen%2fci%2fproducts%2fcompetitive-cost-margin-analytics.html","enabled":true},{"name":"twitter","url":"https://twitter.com/intent/tweet?url=http%3a%2f%2fqa.www.spglobal.com%2fcommodityinsights%2fen%2fci%2fproducts%2fcompetitive-cost-margin-analytics.html&text=Competitive+Cost+and+Margin+Analytics+%7c+S%26P+Global","enabled":true},{"name":"linkedin","url":"https://www.linkedin.com/sharing/share-offsite/?url=http%3a%2f%2fqa.www.spglobal.com%2fcommodityinsights%2fen%2fci%2fproducts%2fcompetitive-cost-margin-analytics.html","enabled":true},{"name":"email","url":"?subject=Competitive Cost and Margin Analytics | S&P Global&body=http%3a%2f%2fqa.www.spglobal.com%2fcommodityinsights%2fen%2fci%2fproducts%2fcompetitive-cost-margin-analytics.html","enabled":true},{"name":"whatsapp","url":"https://api.whatsapp.com/send?text=Competitive+Cost+and+Margin+Analytics+%7c+S%26P+Global http%3a%2f%2fqa.www.spglobal.com%2fcommodityinsights%2fen%2fci%2fproducts%2fcompetitive-cost-margin-analytics.html","enabled":true}]}, {"name":"rtt","enabled":true,"mobdesc":"Top"}
]}