Customer Logins
Obtain the data you need to make the most informed decisions by accessing our extensive portfolio of information, analytics, and expertise. Sign in to the product or service center of your choice.
Customer Logins
EQUITIES COMMENTARY
Mar 21, 2024
S&P Global PMI® and ISM survey comparisons
Two different sets of surveys of US business conditions are provided by S&P Global (previously IHS Markit) and the ISM. This document analyses the main differences in the methodologies, which can cause divergences between the survey findings and also generate different use-cases for the surveys.
We note that, although the ISM surveys of manufacturing and non-manufacturing have longer back-histories than the S&P Global PMI data, the latter offer benefits in terms of earlier publication and higher correlations with comparable official data, as well as exhibiting lower volatility (providing clearer signals of turning points in key economic metrics) and providing greater insights into sub-sector level economic trends. These advantages of the S&P Global PMI can be traced to larger survey sample sizes and the use of a more advanced and widely used methodology than adopted by the ISM.
S&P Global PMI vs. ISM: key differences
In summary, the main methodological differences between the surveys can be identified as follows, including links where available to further information:
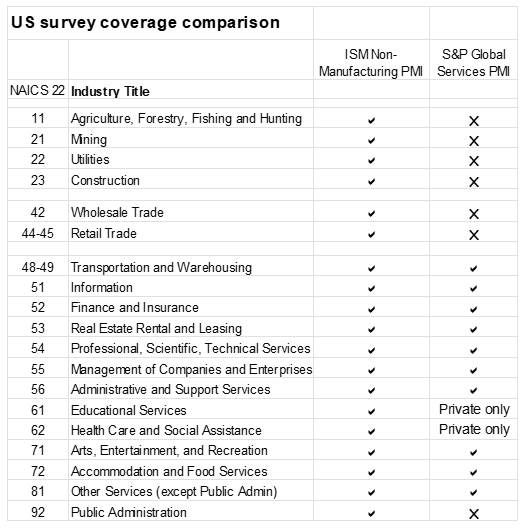
Industry coverage of the economy: the ISM surveys in theory collectively cover the overall US economy whereas the S&P Global surveys cover approximately 70%, but the latter can provide a better guide to corporate performance due to its exclusion of government departments.
Surveyed job titles and functions: ISM surveys are "based on data compiled from purchasing and supply executives" whereas S&P Global PMI data are based on a broader spectrum of job titles, meaning executives such as CEOs and CFOs participate in the surveys, which in practice facilitates a wider industry reach of the surveys beyond those sectors which employ purchasing executives (mainly manufacturing, retail and government departments).
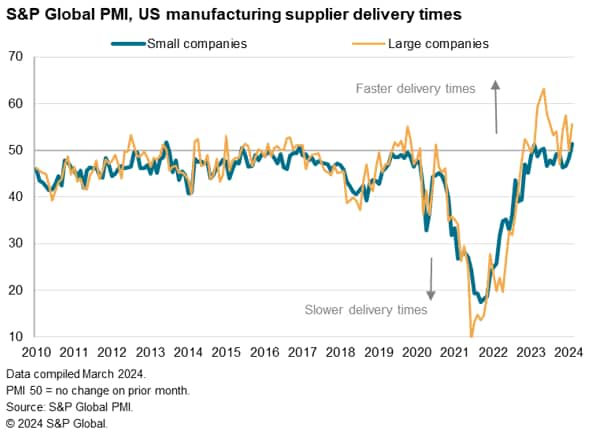
Company size: with ISM survey respondents limited to larger companies (as only larger firms tend to have specific purchasing executives), a more comprehensive size-coverage of S&P Global data can provide broader insights into business conditions as well as more detailed insights into diverging trends at small, medium and larger companies.
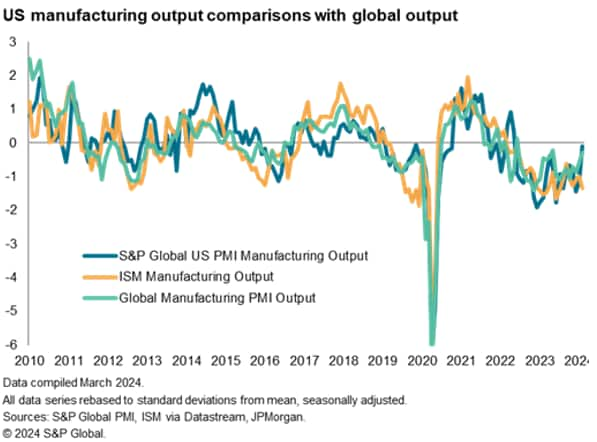
Geographical coverage: S&P Global questionnaires specifically ask companies to restrict their reporting to their US operations, whereas we understand that ISM questionnaires have not included this restriction. This is especially important for multinational companies, who in theory might report on their global rather than solely US operations.
Panel sizes: S&P Global PMI surveys collect data from over 1,300 US companies each month compared to a reported 600-700 for the ISM surveys. Larger panels generate more stable data, meaning a lower noise-to-signal ratio, and also facilitate more detailed data breakdowns.
Sector detail: larger S&P Global panels permit more detailed analysis of business conditions at sub-sector level, such as financial services and consumer goods, as well as company size breakdowns.
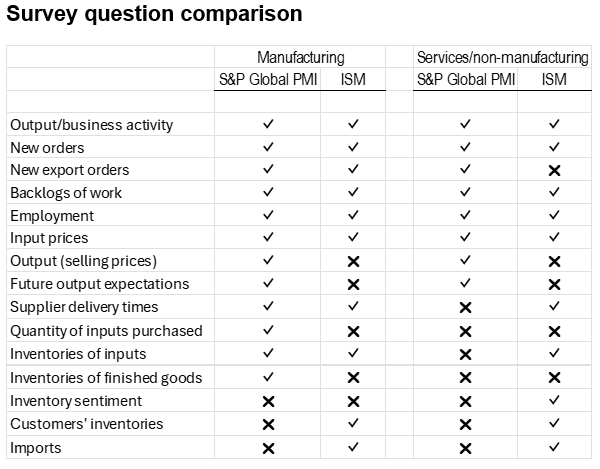
Questions asked: the S&P Global surveys include more questions relating to inflation than the ISM surveys, and fewer purchasing-specific questions, which are often not relevant to non-manufacturers.
Seasonal adjustment: ISM uses forecast seasonal adjustment factors from the X12-ARIMA process whereas the S&P Global surveys use a combination of actual X12-ARIMA seasonal factors combined with an in-house system to provide smoother data series, thereby further improving the signal-to-noise ratio.
Response weighting: ISM panels are "self-weighting" whereas S&P Global surveys use an additional weighting system to ensure larger companies and larger sectors contribute proportionally more to the survey results than smaller firms and smaller sectors.
Headline PMI calculation: different weighting systems are used in the headline PMI calculation.
Data histories: ISM surveys have longer data histories than the S&P Global PMIs, notably for manufacturing. S&P Global manufacturing data are available from 2007 compared to 1948 for the ISM. S&P Global services PMI data are available from 2009 while ISM non-manufacturing data are available from 1997.
International comparability: the use of a methodology consistent with PMIs produced for other countries means only the S&P Global US surveys are directly comparable with other surveys produced by S&P Global in over 45 economies around the World.
Survey performance
In analysing the performance of the ISM and S&P Global surveys, for conciseness in this instance we consider only output trends. These data series in theory correlate most closely with comparable official measures which contribute to changes in GDP, and consequently tend to be the most closely monitored and anticipated by markets.
Manufacturing
We note first that the ISM's manufacturing output index exhibits greater month-to-month volatility than the comparable S&P Global index. Since 2010, the ISM index has varied from its rolling three-month average by 1.1 index points. This falls to 0.8 index points for the S&P Global PMI. The latter therefore demonstrates a smoother trend which allows easier identification of turning points, i.e. a higher signal-to-noise ratio. This lower relative volatility of the S&P Global PMI is also evident in the non-seasonally adjusted data, which suggests that the reduced volatility is at least in part down to a larger sample size relative to the ISM survey, as larger panels tend to generate more stable data.
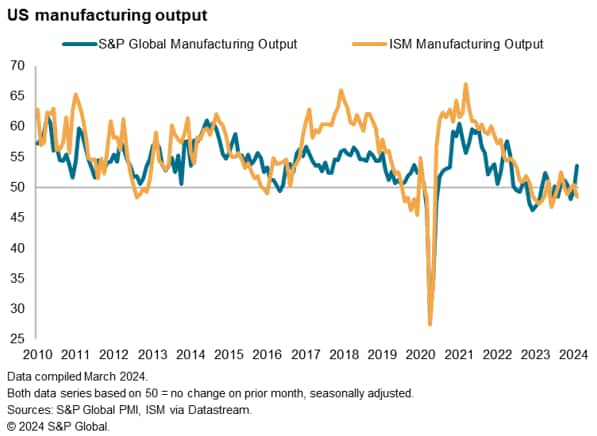
Second, a key period of divergence of the ISM data against both the official measure of manufacturing production and the S&P Global survey was 2016-18, when ISM appear to have significantly overstated output growth. This has been explored in more detail by US Macroeconomic Advisers with the findings pointing to a structural break in the ISM data.
In terms of the survey data accurately anticipating comparable official data, we compare the survey output indices against a three-month-on-three-month per cent change in the official data comparison series, as this displays less volatility than month-on-month changes while avoiding the lags of annual per cent changes.
The S&P Global manufacturing PMI output index exhibits a correlation of 73% against the official measure of manufacturing production, published by the Federal Reserve. By comparison, the ISM manufacturing output index exhibits a lower 64% correlation over this same period.

Services
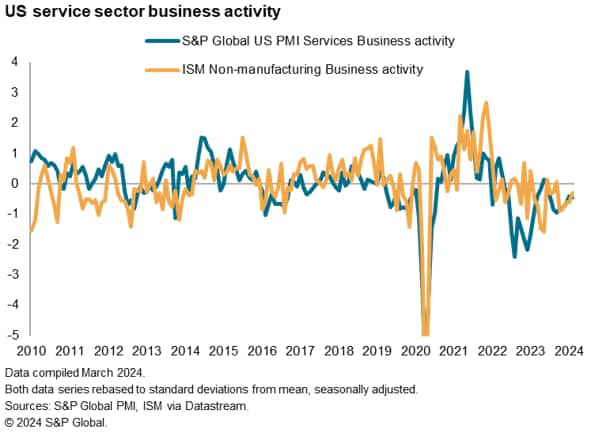
In the service sector, the divergence between the ISM and S&P Global surveys is more striking. First, the ISM's index exhibits considerably greater month-to-month volatility than the S&P Global index. Since 2010 the ISM index has varied from its rolling three-month average by 1.4 index points. This falls to 0.8 points for the S&P Global services PMI. The latter therefore demonstrates a smoother trend which allows easier identification of turning points, i.e. a higher signal-to-noise ratio. A considerably lower relative volatility of the S&P Global PMI is also evident in the non-seasonally adjusted data, which again suggests that the reduced volatility is at least in part down to a larger sample size relative to the ISM survey.
Second, the ISM's business activity index tends to run higher than the equivalent S&P Global index, averaging 58.7 since the start of 2010 compared to 54.3 for the S&P Global index. It is not understood what causes this divergence, though it could potentially be due to the broader coverage of the ISM survey to include government-provided services, which are less affected by the economic cycle and in fact often run countercyclically.

We can better compare the two services business activity (output) indices by normalizing the data using standard deviations from long-run averages.
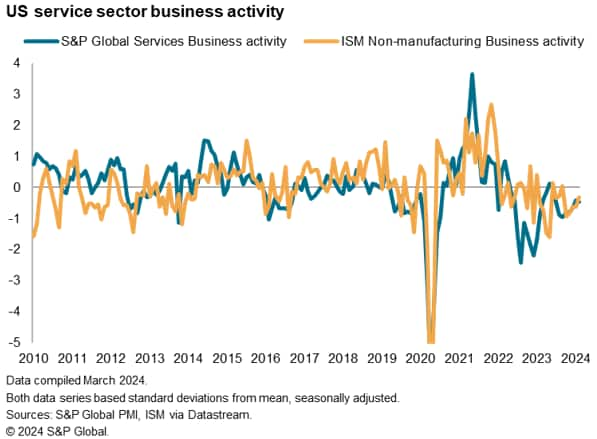
A period of notable divergence between the two services surveys is evident in 2022, when the S&P Global services index fell below that of the ISM. This is attributable to a marked downturn in the financial services sector of the S&P Global data, which corresponds with a similar downturn in official GDP data for financial services at that time (in turn linked to a tightening of financial conditions as interest rates were hiked) but was not apparent in the ISM data, the cause of which we can speculate on there being a deficit of purchasing and supply executives in the financial services sector.

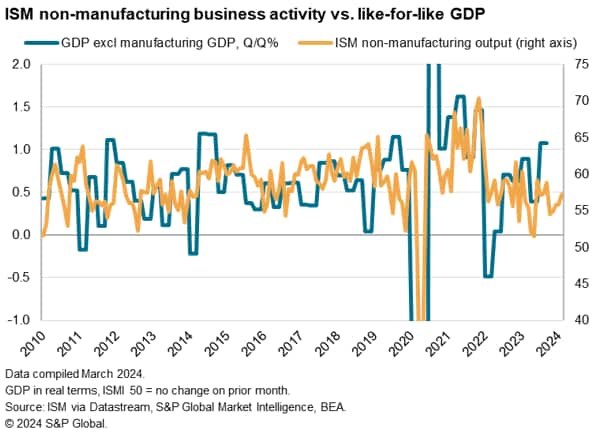
To gauge the performance of the two services surveys against official data, the comparison is complicated by the differences in sectoral coverage. Furthermore, the more recent detailed sector GDP data are potentially subject to significant revision.
However, we observe that the S&P Global PMI data appear to have accurately anticipated the strong downturn in like-for-like sector GDP coverage at the height of the COVID-19 pandemic as well as the strong growth recorded between the middle of 2020 and the start of 2022. Growth in both PMI and official GDP measures has subsequently been patchy, with the caveat that services GDP data are subject to revision.
Since 2010, the S&P Global services PMI has exhibited a correlation of 51% with comparable GDP, but this rises to 65% if the GDP data are smoothed using a two-quarter moving average to remove some of the GDP data volatility.

Turning to the ISM data, the comparison since 2010 shows only the broadest correlation. Volatility in the ISM series creates further issues with identifying underlying GDP trends, and the non-manufacturing index only exhibits a correlation of 46% with a comparable measure of GDP, which merely rises to 51% if the GDP data are smoothed using a two-quarter average.
GDP signals
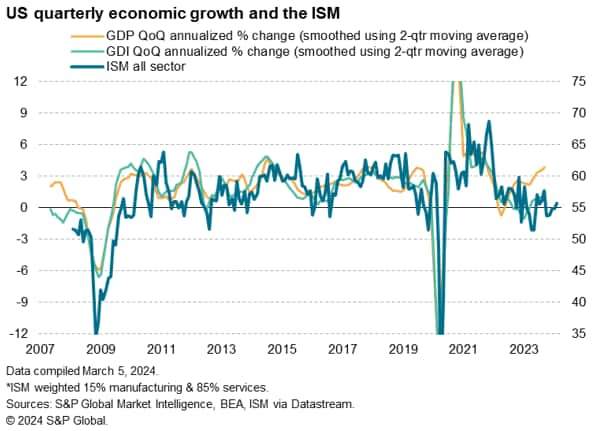
The manufacturing and non-manufacturing/services survey data can be weighted together to create economic indicators with broader GDP coverage. S&P Global present such indicators as "Composite" data.
Comparisons with quarterly gross domestic product (GDP) growth rates reveal similar historical correlations of around 50% for the two survey producers, though this rises to above 60% for the S&P Global PMI if the data are smoothed using two quarter moving averages to reduce data volatility.
Both surveys also exhibit higher correlations with gross domestic income (GDI) than GDP, especially since mid-2022.

Corporate earnings
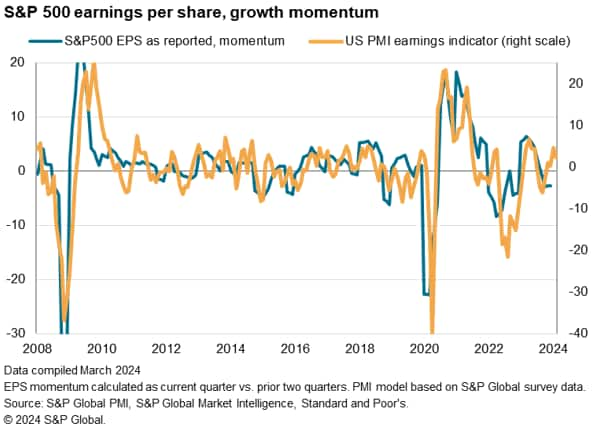
The closer coverage of the S&P Global PMI to the private sector relative to the ISM's broader inclusion of public sector services means the S&P Global data correlate well with corporate earnings data. Using S&P Global PMI data on new orders, output prices, backlogs of work, productivity (the output-to-employment ratio) and supplier delivery times, a corporate earnings indicator can be derived which exhibits a 77% correlation with earnings per share (EPS) growth momentum of the S&P 500, meaning the survey data provide a valuable, accurate, advance guide to changes in US corporate performance.
Detailed insights into S&P Global PMI vs. ISM surveys
Industry coverage
The US S&P Global and ISM manufacturing surveys have similar coverage, but the S&P Global survey for services covers only private service sector companies (which is comparable with all other services PMI data produced internationally), whereas the ISM non-manufacturing survey (now also called the ISM Services PMI) includes everything outside of manufacturing (i.e. construction, education, government services, energy as well as all other services). Note that this prevents international comparability of the ISM Services PMI survey data with other Services PMI survey data.
Thus, while in theory the ISM data cover 100% of GDP, the S&P Global surveys cover around 70% (or 80% of total private sector GDP).
Job title and job functions
S&P Global PMI surveys have no restriction on the job functions of survey respondents, but ISM data are purely "based on data compiled from purchasing and supply executives". Note that S&P Global moved away from solely focusing on the purchasing profession as such roles were found to have often been less suitable to surveys outside of manufacturing, where the purchasing manager is often less involved in the main commercial activities of the firms, typically being more occupied in office supplies. A typical job title of a respondent to S&P Global's services survey is one related to finance functions, such as CFO or Accountant, or general management. A list of the most frequent job titles in S&P Global's Services PMI are listed below:
• CEO, CFO, COO
• Director of Finance/Finance Manager/Finance Director
• General Manager
• Owner
• President
Company size
ISM data are based only on ISM members and other purchasing and supply executives. As such, the ISM data are likely to be reflective of business conditions at larger companies, with small- and medium-sized firms under-represented (as smaller firms tend not to have dedicated purchasing and supply executives). In contrast, S&P Global structures its surveys to accurately represent the true mix of companies by size within each sector. This can be important, as small and large firms often perform very differently at different stages of the business cycle, or in response to policy changes, for example.
An analysis of the S&P Global Services PMI by size, for instance, illustrates how smaller companies were more affected by the various waves of COVID-19 during the pandemic than larger firms.

In manufacturing, the S&P Global data show that the post-pandemic improvement in supplier delivery times has been limited to larger US companies, signaling that smaller firms have continued to suffer supply chain stress on average.
Geographical coverage
S&P Global questionnaires for its US PMI surveys specifically ask companies to restrict their reporting to their US operations, whereas the ISM questionnaires have not included this restriction as far as we are aware. This is especially important for multinational companies, who in theory might report on their global rather than US operations. This may explain some periods of stronger ISM readings relative to the US S&P Global PMI, such as 2017-18, when the ISM data showed similar trends to global manufacturing output but diverged with the US PMI data produced by S&P Global.
Survey panel sizes
S&P Global's survey panels are larger than the ISM's stated panel sizes. Note also that stated panel size can also often differ to the actual number of responses received. Unlike S&P Global, ISM does not disclose actual numbers of questionnaires received.
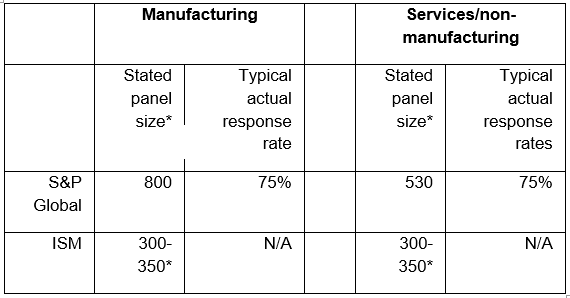
* Anecdotally, ISM has in the past stated that its panel sizes are 300-350 but we are unable to find any reference to panel sizes or response rates on itspress releasesor associated documentation to confirm these numbers.
Larger survey panels have the advantage of producing data series that are typically less volatile than smaller panels, which seems especially evident when the services/non-manufacturing data for the two US surveys are compared.
Sector detail
Larger sample sizes allow S&P Global to provide data by sub-sector within manufacturing and services. For example, manufacturing data are provided for consumer durable and non-durable goods, as well as intermediate goods (i.e. manufactured inputs supplied to other producers) and investment goods (i.e. plant, machinery, and other capital equipment).
Services data are meanwhile also provided by S&P Global for sectors such as financial services, allowing the generation of all relevant PMI sub-indices for the following sectors:
• Basic Materials
• Consumer Goods
• Consumer Services
• Financials
• Healthcare
• Industrial Goods & Services
• Technology
These S&P Global sector PMI data enable cross-sector comparison of performance within the US as well as providing advance details on likely developments in the official economic data, such as sector contributions to GDP growth, well in advance of the publication of official data.

Questionnaires
ISM and S&P Global manufacturing questionnaires are broadly similar, but S&P Global's pilot studies for its services PMI survey found questions relating to supply chain management (including stocks of inventories) to often be irrelevant for many services sub-industries. S&P Global instead focusses on core questions of greater relevance to commercial activities in sectors such as banking, legal and accounting services.
Perhaps most notably, the ISM questionnaires only include questions relating to raw material input prices, whereas the S&P surveys include questions relating to broader input costs as well as output (selling prices), the latter notably capturing changes in wage effects as well as other cost influences, which are especially important in the service sector.
Seasonal adjustment
The surveys use different methods of seasonal adjustment, with S&P Global indices using X12 combined with an in-house method to estimate seasonal adjustment factors for the latest numbers every month. ISM, in contrast, uses a system whereby X12 forecasts the coming year's seasonal adjustment factors in advance. The ISM methodology means that the latest data are not in fact used in the seasonal factor estimation process, which becomes an increasingly significant disadvantage as the calendar year proceeds.
Response weighting
S&P Global surveys use a weighting system to ensure the results accurately reflect the true official structure of the economy. Weights reflect both company size and the relative importance of the sub-sector in which the company operates. A large company in a large sector will therefore tend to carry a proportionally higher weight in the survey results than a small company in a smaller sector. ISM surveys do not include such a weighting process in the calculation of the results but are instead dependent on the panels being 'self-weighting'.
Headline PMI calculation
The method used to calculate the ISM headline manufacturing PMI is inconsistent with all other PMI surveys, meaning the headline numbers are not internationally comparable. ISM uses equal weights of 0.2 for each component of its headline manufacturing 'PMI'. In contrast, S&P Global uses weights comparable with those of all other PMIs produced globally (as follows: new orders x 0.3, output x 0.25, employment x 0.2, suppliers' delivery times (inverted) x 0.15, inventories of purchases x 0.1).
Note also that ISM produces a composite headline PMI for non-manufacturing, whereas S&P Global uses the Business Activity Index as the services survey headline number.
Data histories
ISM surveys have longer data histories than the S&P Global PMIs, notably for manufacturing. S&P Global manufacturing data are available from 2007 compared to 1948 for the ISM. S&P Global Services PMI data are available from 2009 while ISM non-manufacturing data are available from 1997.
International comparability
The use of a consistent methodology with PMIs produced for other countries means the S&P Global US surveys are directly comparable with other surveys produced by S&P Global in over 40 economies around the World, making for easy inclusion of the US PMI data into global and regional aggregates.
Disclaimer
The information on the ISM surveys and methodology presented in this document is correct to the best of our knowledge, based on information gleaned from ISM press releases and other documentation, as well as telephone calls with the ISM representatives over the years. If any of the information is incorrect or out of date then we will be happy to amend as appropriate.
Purchasing Managers' Index™ and PMI® are either trademarks or registered trademarks of S&P Global Inc or licensed to S&P Global Inc and/or its affiliates.
This Content was published by S&P Global Market Intelligence and not by S&P Global Ratings, which is a separately managed division of S&P Global. Reproduction of any information, data or material, including ratings ("Content") in any form is prohibited except with the prior written permission of the relevant party. Such party, its affiliates and suppliers ("Content Providers") do not guarantee the accuracy, adequacy, completeness, timeliness or availability of any Content and are not responsible for any errors or omissions (negligent or otherwise), regardless of the cause, or for the results obtained from the use of such Content. In no event shall Content Providers be liable for any damages, costs, expenses, legal fees, or losses (including lost income or lost profit and opportunity costs) in connection with any use of the Content.
Chris Williamson, Chief Business Economist, S&P Global
Market Intelligence
Tel: +44 207 260 2329
chris.williamson@spglobal.com
© 2024, S&P Global. All rights reserved. Reproduction in whole
or in part without permission is prohibited.
Purchasing Managers' Index™ (PMI®) data are compiled by S&P Global for more than 40 economies worldwide. The monthly data are derived from surveys of senior executives at private sector companies, and are available only via subscription. The PMI dataset features a headline number, which indicates the overall health of an economy, and sub-indices, which provide insights into other key economic drivers such as GDP, inflation, exports, capacity utilization, employment and inventories. The PMI data are used by financial and corporate professionals to better understand where economies and markets are headed, and to uncover opportunities.
This article was published by S&P Global Market Intelligence and not by S&P Global Ratings, which is a separately managed division of S&P Global.
{"items" : [
{"name":"share","enabled":true,"desc":"<strong>Share</strong>","mobdesc":"Share","options":[ {"name":"facebook","url":"https://www.facebook.com/sharer.php?u=http%3a%2f%2fqa.www.spglobal.com%2fmarketintelligence%2fen%2fmi%2fresearch-analysis%2fsp-global-pmi-and-ism-survey-comparisons.html","enabled":true},{"name":"twitter","url":"https://twitter.com/intent/tweet?url=http%3a%2f%2fqa.www.spglobal.com%2fmarketintelligence%2fen%2fmi%2fresearch-analysis%2fsp-global-pmi-and-ism-survey-comparisons.html&text=S%26P+Global+PMI%c2%ae+and+ISM+survey+comparisons+%7c+S%26P+Global+","enabled":true},{"name":"linkedin","url":"https://www.linkedin.com/sharing/share-offsite/?url=http%3a%2f%2fqa.www.spglobal.com%2fmarketintelligence%2fen%2fmi%2fresearch-analysis%2fsp-global-pmi-and-ism-survey-comparisons.html","enabled":true},{"name":"email","url":"?subject=S&P Global PMI® and ISM survey comparisons | S&P Global &body=http%3a%2f%2fqa.www.spglobal.com%2fmarketintelligence%2fen%2fmi%2fresearch-analysis%2fsp-global-pmi-and-ism-survey-comparisons.html","enabled":true},{"name":"whatsapp","url":"https://api.whatsapp.com/send?text=S%26P+Global+PMI%c2%ae+and+ISM+survey+comparisons+%7c+S%26P+Global+ http%3a%2f%2fqa.www.spglobal.com%2fmarketintelligence%2fen%2fmi%2fresearch-analysis%2fsp-global-pmi-and-ism-survey-comparisons.html","enabled":true}]}, {"name":"rtt","enabled":true,"mobdesc":"Top"}
]}


