Customer Logins
Obtain the data you need to make the most informed decisions by accessing our extensive portfolio of information, analytics, and expertise. Sign in to the product or service center of your choice.
Customer Logins
ECONOMICS COMMENTARY
Jan 02, 2024
US factories end 2023 on soft note amid signs of excess operating capacity

US manufacturers ended the year on a sour note, according to S&P Global's PMI survey. Output fell at the fastest rate for six months as the recent order book decline intensified. Manufacturing will therefore likely have acted as a drag on the economy in the fourth quarter.
The slowdown is spreading to the labor market. Payrolls were cut for a third month running as increasing numbers of firms grew concerned about the development of excess operating capacity. The fourth quarter has consequently seen factories reduce employment at a pace not seen since 2009 barring only the early pandemic lockdown months.
With factories also cutting back sharply on their purchases in inputs again in December, suppliers were also less busy on average, again hinting at the development of spare capacity.
While there was some uplift in the rate of both raw material and factory gate selling price inflation, firms' costs notably continued to rise at a pace below the survey's long-run average to hint at historically subdued industrial price pressures.
Given current order book trends, the overall picture from the survey is one of supply exceeding demand for many goods, which points to downside risks to production, employment and prices as we head into 2024. Potential supply chain disruptions need to be monitored, however, notably in terms of shipping, as the survey has clearly demonstrated in the past how supply chain tensions quickly feed through to higher prices.
Below we plot our top five charts from the S&P Global manufacturing PMI survey for the US, including highlights from the survey's sub-indices.
Chart 1: Production ends soft year with worsening trend
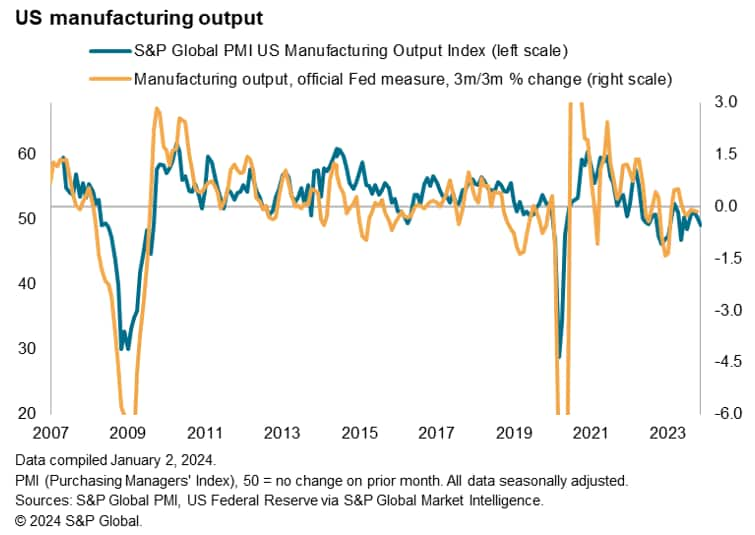
The Output Index from S&P Global's US PMI survey, which measures monthly changes in production volumes, fell to a six-month low in December.
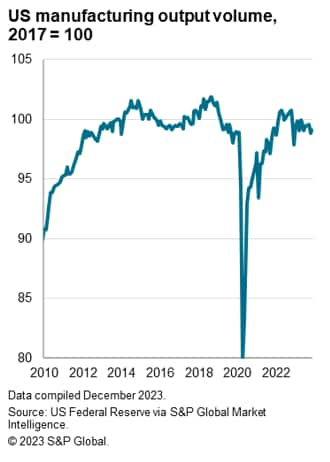
The December reading of 48.1 points to a worsening production trend at the end of a disappointing overall year for US manufacturing. The index averaged 49.5 throughout 2023, indicating a very modest overall contraction of production. That compares with official data, which up to November (the latest month for which statistics are available) showed output running 0.5% below 2022 levels on average.
As of November, production was 2.6% below its pre-pandemic peak, and was running 0.6% below the third quarter on average during the first two months of the fourth quarter, thereby adding to the PMI's signal of manufacturing acting as a drag on the economy.
Chart 2: Spare production capacity signaled
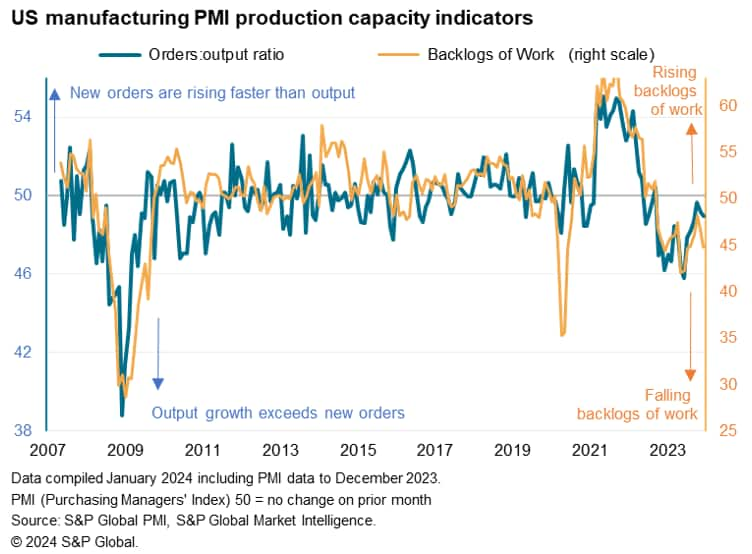
Backlogs of work fell sharply in December, hinting at the development of spare operating capacity. In contrast to the continual rise in backlogs of work seen between August 2020 and September 2022, when production was constrained by supply shortages, the past 15 months have seen a sustained decline in backlogs of work. This contraction reflects a combination of fewer supply constraints alongside a downturn in new orders. New orders have now fallen for 16 of the past 19 months. Current production levels are therefore being supported by orders placed in prior months. As these back orders are depleted, companies come under pressure to cut operating capacity.
Chart 3: Employment falls in Q4
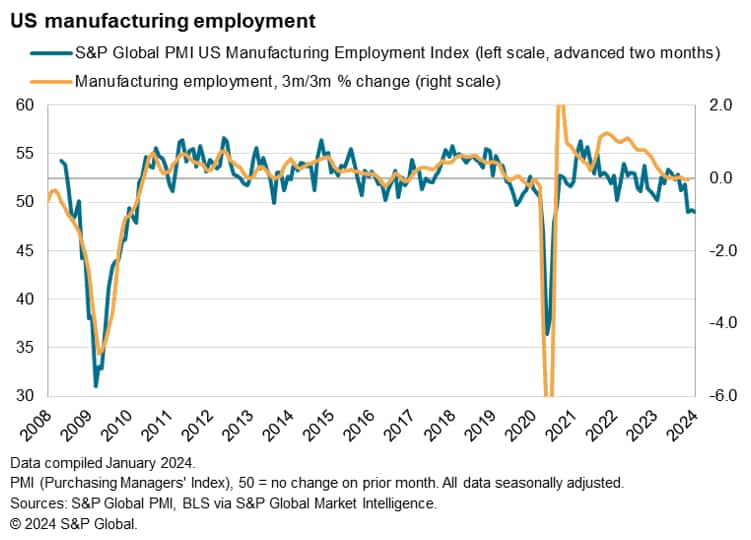
Factory jobs were cut on balance for a third successive month in December, according to the PMI's Employment Index. If the early pandemic lockdown months of 2020 are ignored, the recent job shedding is the most severe recorded by the survey since the global financial crisis of 2009. While some factories still report hard-to-fill vacancies, in the majority of cases the decline in employment in December reflected pressure to cut costs and capacity in the wake of weak demand.
A divergence of the PMI employment against the official payroll numbers during the pandemic appears to have now worked out of the comparison, albeit with the recent payroll numbers distorted by the auto workers strike (and subsequent return to work). The historical comparisons suggest that the PMI is roughly indicative of manufacturing shedding around 20k workers per month.
Chart 4: Factories slash input buying
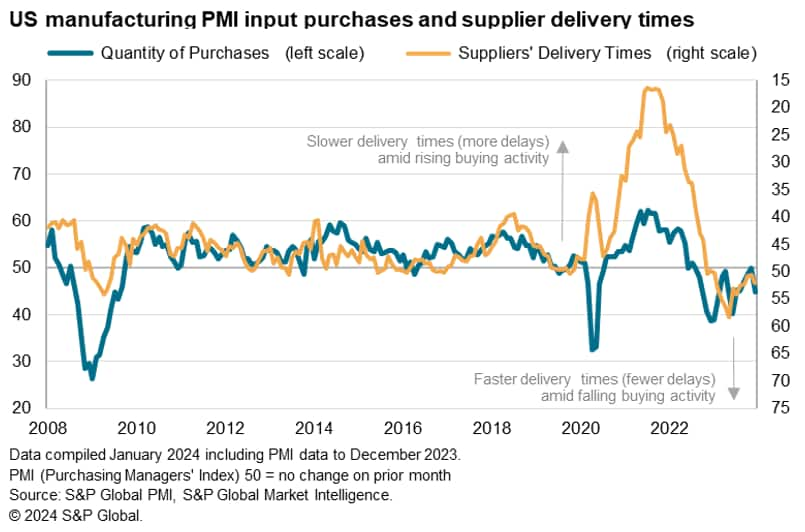
Manufacturers also cut back on their purchases of inputs in December, reflecting a desire to cut costs in the face of weaker production requirements. The quantity of goods purchased by factories fell at the steepest rate since last June, dropping for a seventeenth successive month. This represents the longest and deepest spell of falling purchases since the global financial crisis.
The pull-back in purchasing has taken pressure off supply chains. Whereas longer delivery times were reported to an unprecedented degree between 2020 and much of 2022, supplier lead times shortened continually over the course of 2023, up to and including December. Traditionally, this shortening of delivery times is indicative of a shift from a sellers'- to a buyers'-market.
Chart 5: Lower price pressures
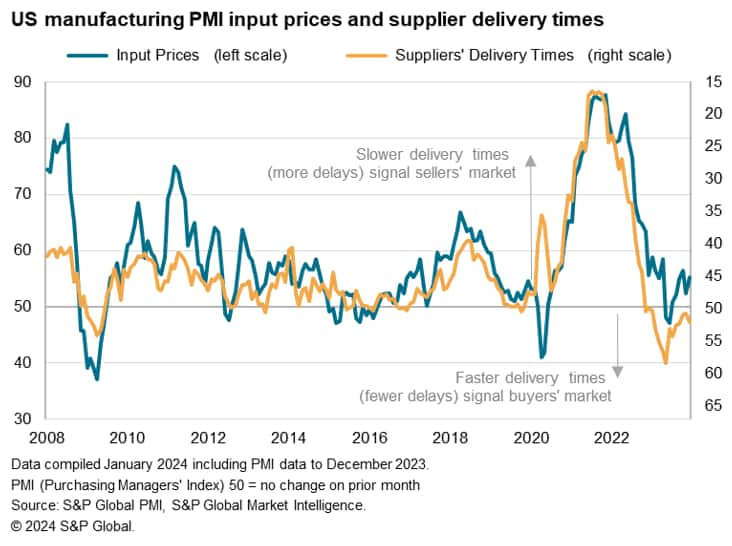
The alleviated pressure on supply chains over 2023, and the accompanying shift towards a buyers' market, has resulted in greatly reduced input cost inflation. Average prices paid for purchases by factories fell in May and June and have since risen only modestly by historical standards of the survey.
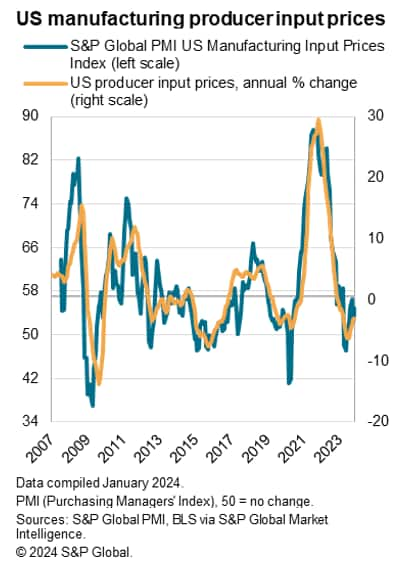
The PMI input price data have acted as a reliable advance indicator of official producer prices, the survey consistent with a further fall in prices during December on a year-on-year basis. Hence manufacturing appears to have provided a further disinflationary force on inflation in the overall economy at the end of 2023, albeit to a lesser degree than in the summer.
However, at the time of writing there are growing concerns over supply chain stability in the Red Sea, and further geopolitical risks can easily cause supply chain disruptions. Our fifth chart illustrated how longer supplier delivery times rapidly translate into higher prices in today's world. Global events therefore need to be monitored closely for supply chain and inflation risks in 2024.
Access the press release here.
Chris Williamson, Chief Business Economist, S&P Global Market Intelligence
Tel: +44 207 260 2329
© 2024, S&P Global. All rights reserved. Reproduction in whole
or in part without permission is prohibited.
Purchasing Managers' Index™ (PMI®) data are compiled by S&P Global for more than 40 economies worldwide. The monthly data are derived from surveys of senior executives at private sector companies, and are available only via subscription. The PMI dataset features a headline number, which indicates the overall health of an economy, and sub-indices, which provide insights into other key economic drivers such as GDP, inflation, exports, capacity utilization, employment and inventories. The PMI data are used by financial and corporate professionals to better understand where economies and markets are headed, and to uncover opportunities.
This article was published by S&P Global Market Intelligence and not by S&P Global Ratings, which is a separately managed division of S&P Global.
{"items" : [
{"name":"share","enabled":true,"desc":"<strong>Share</strong>","mobdesc":"Share","options":[ {"name":"facebook","url":"https://www.facebook.com/sharer.php?u=http%3a%2f%2fqa.www.spglobal.com%2fmarketintelligence%2fen%2fmi%2fresearch-analysis%2fus-factories-end-2023-on-soft-note-amid-signs-of-excess-operating-capacity-Jan24.html","enabled":true},{"name":"twitter","url":"https://twitter.com/intent/tweet?url=http%3a%2f%2fqa.www.spglobal.com%2fmarketintelligence%2fen%2fmi%2fresearch-analysis%2fus-factories-end-2023-on-soft-note-amid-signs-of-excess-operating-capacity-Jan24.html&text=US+factories+end+2023+on+soft+note+amid+signs+of+excess+operating+capacity+%7c+S%26P+Global+","enabled":true},{"name":"linkedin","url":"https://www.linkedin.com/sharing/share-offsite/?url=http%3a%2f%2fqa.www.spglobal.com%2fmarketintelligence%2fen%2fmi%2fresearch-analysis%2fus-factories-end-2023-on-soft-note-amid-signs-of-excess-operating-capacity-Jan24.html","enabled":true},{"name":"email","url":"?subject=US factories end 2023 on soft note amid signs of excess operating capacity | S&P Global &body=http%3a%2f%2fqa.www.spglobal.com%2fmarketintelligence%2fen%2fmi%2fresearch-analysis%2fus-factories-end-2023-on-soft-note-amid-signs-of-excess-operating-capacity-Jan24.html","enabled":true},{"name":"whatsapp","url":"https://api.whatsapp.com/send?text=US+factories+end+2023+on+soft+note+amid+signs+of+excess+operating+capacity+%7c+S%26P+Global+ http%3a%2f%2fqa.www.spglobal.com%2fmarketintelligence%2fen%2fmi%2fresearch-analysis%2fus-factories-end-2023-on-soft-note-amid-signs-of-excess-operating-capacity-Jan24.html","enabled":true}]}, {"name":"rtt","enabled":true,"mobdesc":"Top"}
]}