Published September 2023
Activated carbon is an amorphous form of elemental carbon prepared by the destructive distillation of any one of a variety of carbonaceous raw materials, including wood, coal or coconut shells. It is used as a substrate primarily to selectively adsorb gases, vapors or colloidal solids from liquids or gases. The principal commercial product forms of activated carbon are granular, powdered, extruded and fibers.
The activated carbon business has been and will continue to be driven by environmental regulations — principally regarding water and air purification — especially in the mature and more industrialized areas of the world, but increasingly in developing countries and regions. Environmental issues will continue to be the predominant force in the markets of rapidly developing countries, particularly mainland China and India.
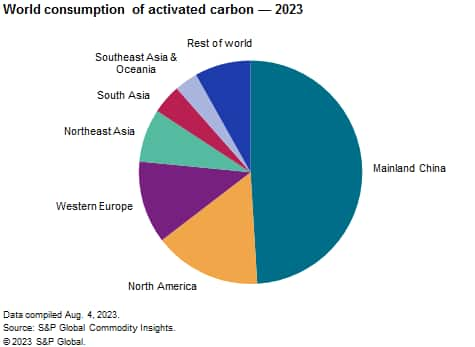
The following chart shows world consumption of activated carbon:
Total world capacity has increased by approximately 400,000 metric tons since 2020. Most of this growth took place in mainland China. A growing trend is the push or recommendation to use reactivated carbon. Reactivation of spent carbon can be a cost-effective alternative to virgin activated carbon production because of reduced disposal costs and a lower CO₂ footprint for reactivated carbon.
Worldwide, water treatment accounts for 40% of the total consumption and continues to be the largest application for activated carbon. Air and gas purification accounted for 22% of the total, followed by food processing applications at 18%. During 2023–28, these percentages are not expected to change significantly. The consumption of activated carbon varies by region, both in terms of application and growth rate. For example, in the United States, activated carbon for food processing applications accounted for more than 6% of the total, whereas in mainland China, food processing applications made up 14% of the total. Total consumption in the United States is forecast to grow at an average annual rate of 1.0% compared with 6.1% in mainland China.
US regulations controlling mercury emissions from coal-fired power plants (where compliance had to be met by April 2016) contributed to the large consumption of activated carbon during 2012–16. As the compliance deadline has passed, consumption has declined in this application as of 2023, driven by coal plant retirements. There will continue to be coal plant retirements, and coal-fired generation will increasingly lose market share not only to natural gas, but also to renewable energy generation, driving down demand for activated carbon. However, the United States may grow significantly in its water purification markets, especially if future regulations are passed controlling certain chemicals in drinking water.
On Jan. 19, 2013, a treaty called the Minamata Convention on Mercury was finalized in Geneva; it involved over 140 countries agreeing on a set of legally binding rules to control mercury pollution. The Minamata Convention entered into force in August 2017. As of June 2023, there are 144 party members of the Convention. It provides a catalyst to global efforts to reduce and eliminate the use of mercury and mercury compounds. Over the next decades, the implementation of this international agreement will help reduce mercury pollution from the human activities responsible for the most significant mercury releases to the environment.
Emerging uses for activated carbon include capacitors and batteries as well as adsorbed natural gas (ANG) applications (for alternative fuel light-duty vehicles) and storage of renewable natural gas. Although the energy field is a long-term application, this could be a significant market for activated carbon in the future.
Developing countries or regions, such as mainland China and the Indian Subcontinent, will record average annual growth of approximately 6% during 2023–28, while Central and Eastern Europe, the Middle East, Africa, and Southeast Asia will record growth rates of 3%-4%. Environmental concerns and/or legislation are driving growth in these regions, especially in mainland China. Water treatment in particular, but also air purification, are contributing to the growth of activated carbon. The developing world of Central Europe, Eurasia, the Middle East, and Africa will grow at larger rates than some other regions because they need to align with the environmental regulations both in terms of water quality and air purification. For instance, the EU member countries are being monitored, particularly in Central Europe, where the member states need to catch up with the requirements. Food processing is also a large contributor to growth, especially in mainland China.
Overall, the forecast global average annual growth rate for activated carbon will be about 4.3% through 2028, driven by the large consuming regions of North America, Western Europe and mainland China.
For more detailed information, see the table of contents, shown below.
S&P Global’s Chemical Economics Handbook – Activated Carbon is the comprehensive and trusted guide for anyone seeking information on this industry. This latest report details global and regional information, including
Key benefits
S&P Global’s Chemical Economics Handbook – Activated Carbon has been compiled using primary interviews with key suppliers and organizations, and leading representatives from the industry in combination with S&P Global’s unparalleled access to upstream and downstream market intelligence and expert insights into industry dynamics, trade and economics.
This report can help you
- Identify trends and driving forces influencing chemical markets
- Forecast and plan for future demand
- Understand the impact of competing materials
- Identify and evaluate potential customers and competitors
- Evaluate producers
- Track changing prices and trade movements
- Analyze the impact of feedstocks, regulations and other factors on chemical profitability


